Rating: HOLD
HOLD (5-tier) · quality defensive · conviction: low
| Metric | Value |
|---|---|
| Current Price | $108 |
| Triangulated Fair Value | $89 (-18% vs spot · triangulated FV) |
| 12-mo Scenario PWEV | $103 (-5% vs spot · 12m PWEV) |
| Forward P/E | 10.5x |
| Market Cap | $133B |
| 52-Week Range | $84–$135 |
EPS basis for the forward P/E and all scenario multiples: consensus forward EPS (broker-adjusted, non-GAAP).
Methodology: Valuation triangulated across five independent anchors — Monte Carlo (Student-t + regime switching), an independent DCF, peer re-rating, a sum-of-parts, and a scenario-weighted PWEV. Figures reconciled to Alpha Vantage 2026-06-26. Each chart below sits with the part of the thesis it evidences.
General research for a skeptical institutional reader. Not personalised investment advice; no position sizing or trade instructions. Figures as of the analysis date; verify before acting.
Investment Committee Summary
| Rating | HOLD · HOLD (5-tier) |
| Classification · conviction | quality defensive · low |
| Triangulated fair value | $89 (-18% vs spot · triangulated FV) |
| 12-mo scenario PWEV | $103 (-5% vs spot · 12m PWEV) |
| Next catalyst | 2026-08-06 — Quarterly earnings |
| Primary thesis-break | Average quarterly WTI benchmark ($/bbl) < 60 (2 consecutive prints) |
📎 Download the full model (Excel) — DCF line items, scenarios, sensitivity, assumptions, and extended fundamentals.
Rating Bridge
Rating = HOLD because:
- Probability-weighted scenario value implies -5% vs spot
- Monte Carlo median implies -15% vs spot
- DCF fair value implies -26% vs spot — but this is terminal-value sensitive (exit-multiple $80 vs Gordon $118, 48% apart), so it carries less weight
- Bear case (Structural — Peak Demand / Sub-$50 Oil) downside is -76% vs spot
- Net: reward/risk of 0.2× is not asymmetric enough for a Buy and not impaired enough for a Sell — hence Hold.
Investment Thesis
At $103.96 (2026-06-26) the market prices ConocoPhillips at roughly 10.1× forward earnings — a continuation of mid-cycle conditions: $65–75 WTI, a $61.2bn revenue guide, disciplined capex and about $9bn of annual cash returns (AV FY2025: $4.0bn dividends, $5.0bn buybacks). The engine's view differs through two anchors. The capex-bridged DCF returns $81.91 per share at a 10% WACC and 8× terminal multiple, and the bridge flags incremental ROIC of ~1.9% — the current build dilutes value at strip prices. The scenario set carries a 25% structural peak-demand weight whose $25.96 target sits below the 52-week low of $83.51, and Monte Carlo puts the probability of fair value above spot at 40%, with 66% of outcome variance in the multiple rather than fundamentals. The probability-weighted target of $102.77 lands within 2% of spot, so the rating is HOLD: the upcycle scenarios are real but already paid for. The single most damaging risk is a transition-driven de-rate, where sustained sub-$50 oil compresses earnings and the multiple together against $17.45bn of net debt.
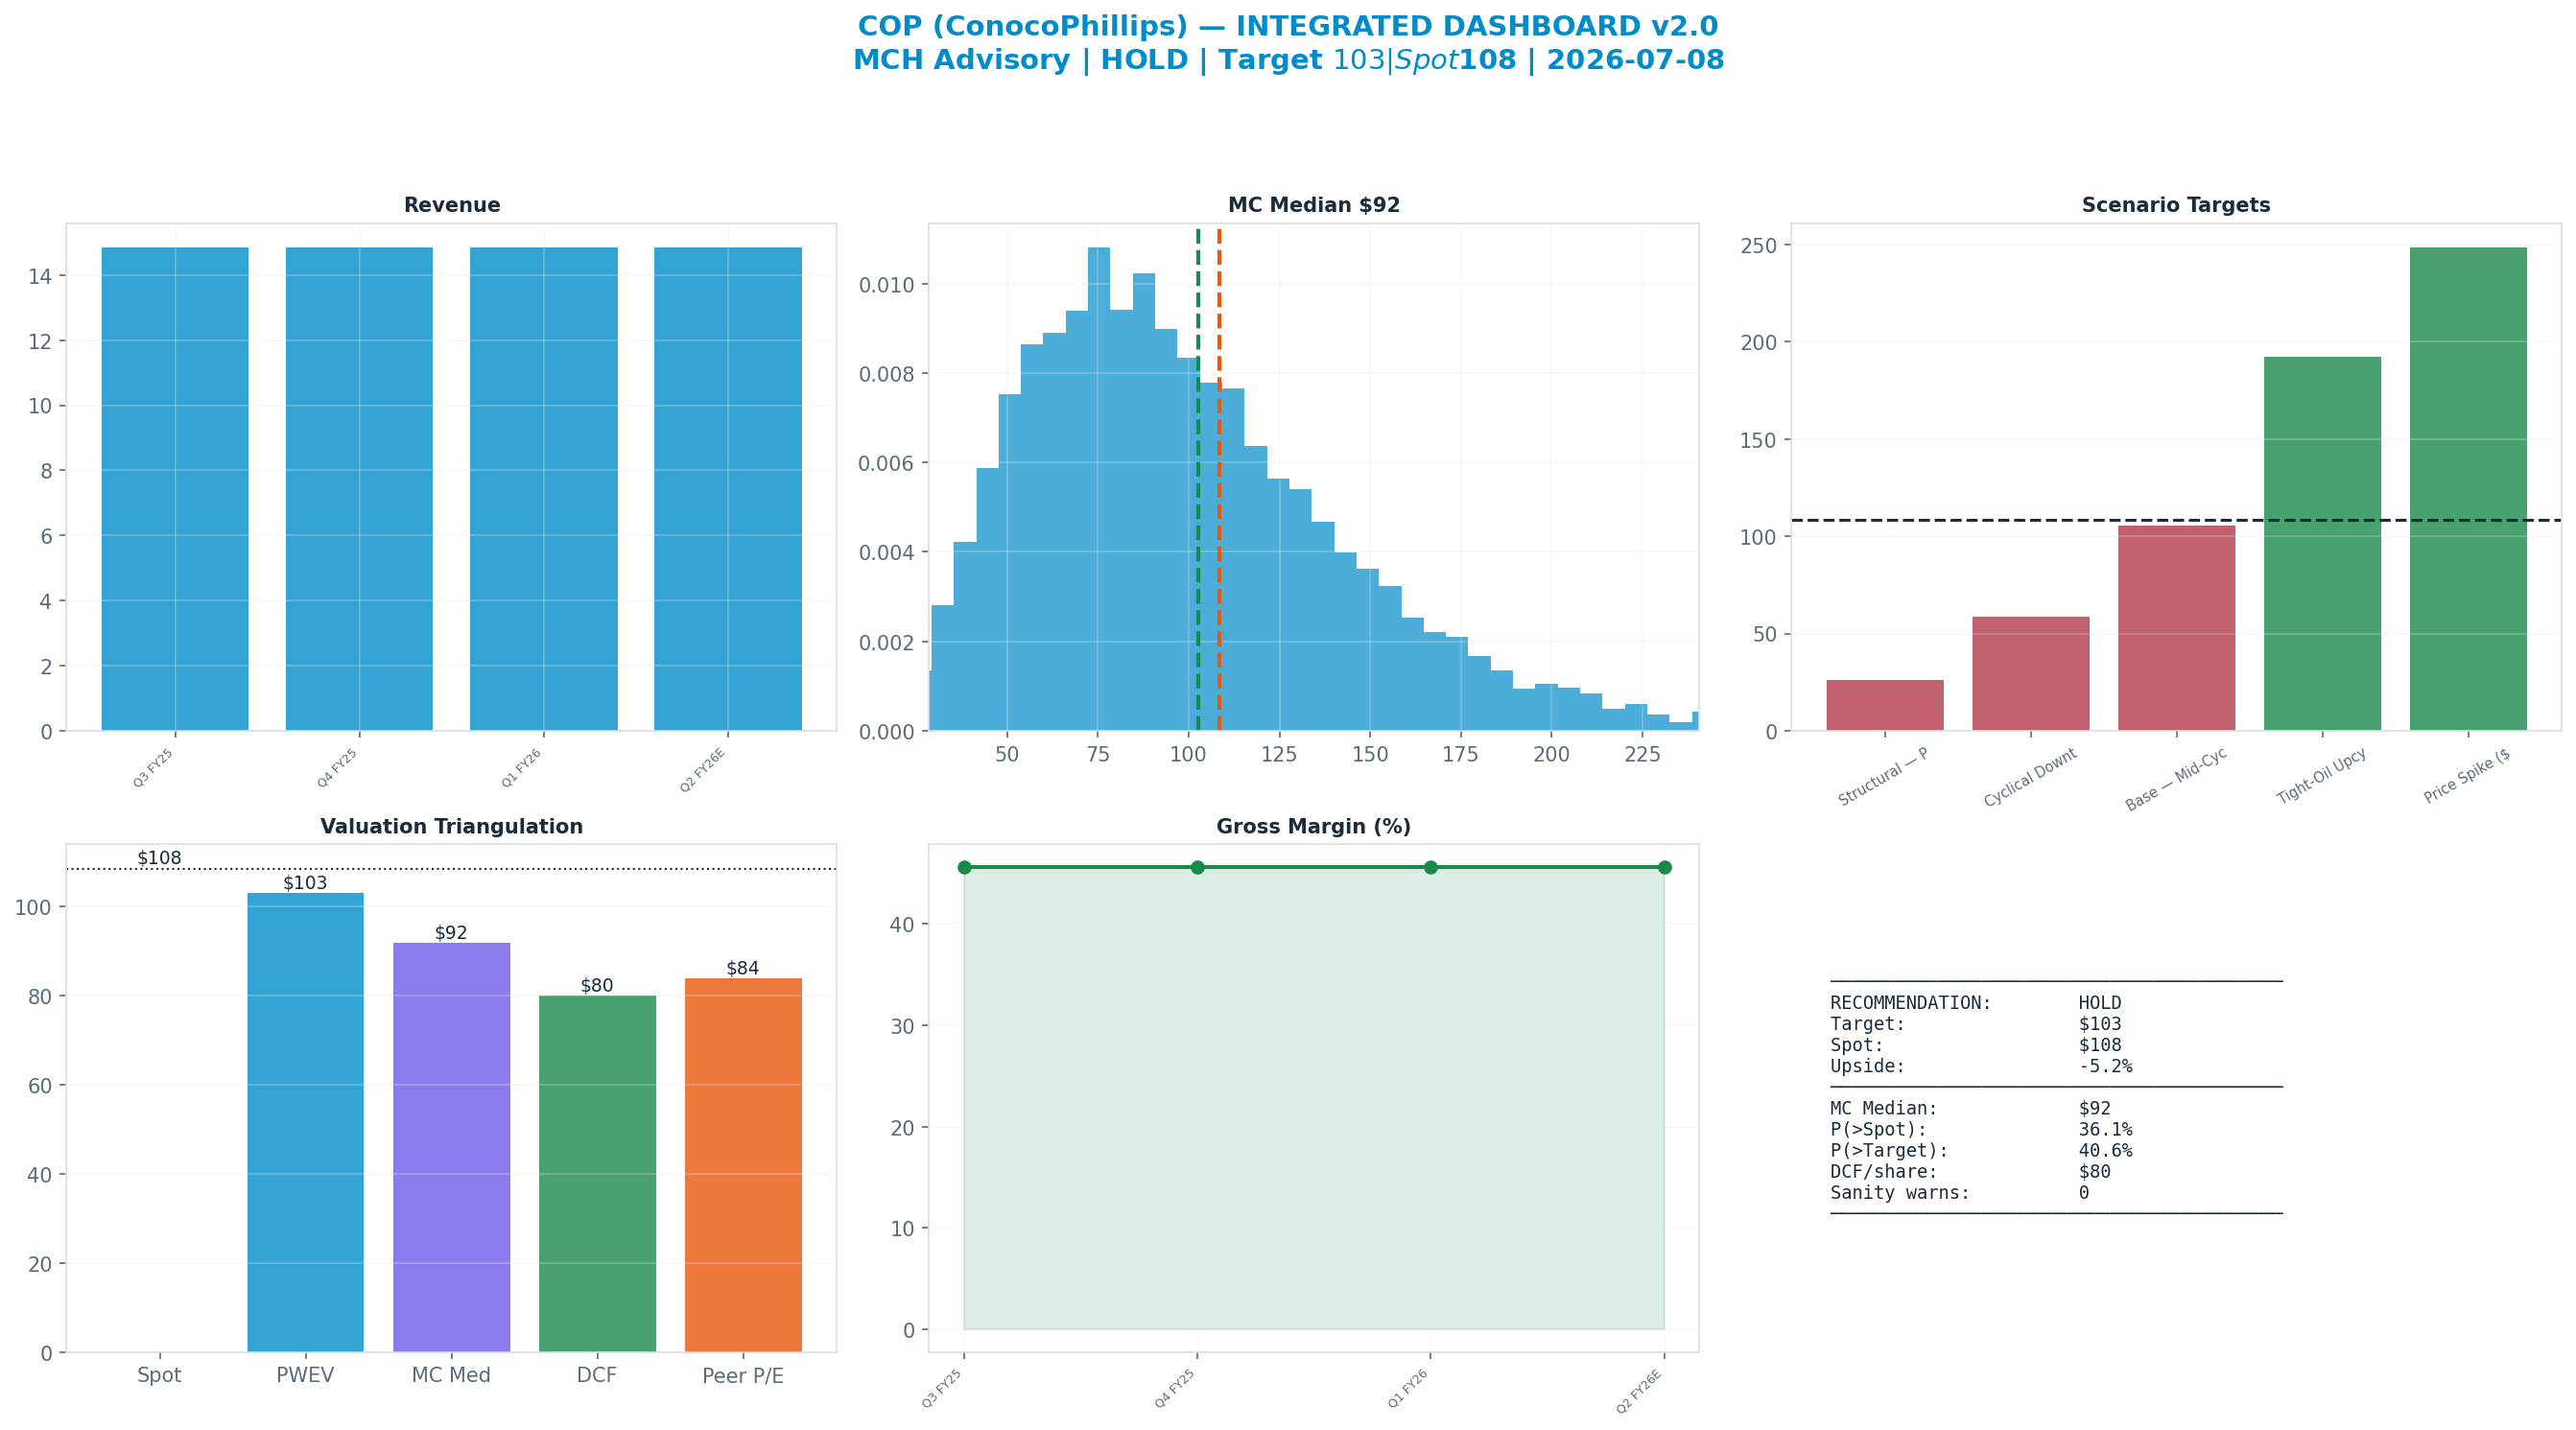
The dashboard below is the whole argument on one page: spot ($108) against each valuation anchor, the scenario tree, technicals and the options-implied move.
Anti-Thesis (The Real Bear Case)
The structural bear is not a token hedge; it carries 25% weight. If global oil demand peaks earlier than consensus assumes, the marginal barrel is repriced permanently, not cyclically. Realisations settle below $50 WTI, operating margin compresses towards 14%, and earnings fall to roughly $4 per share. Critically, the market would not pay a mid-cycle multiple for those earnings: transition risk turns E&P equity into a run-off asset class and the multiple de-rates towards 6.5×, producing a value near $26 — below the 52-week low. ConocoPhillips is pure price beta with no downstream or fee-based buffer, $17.45bn of net debt, and a capex programme near $12–13bn a year that cannot be cut quickly mid-build. In that state buybacks stop first, the dividend follows, and the equity compounds the commodity's decline.
Key Debate
P/E Multiple explains 66% of Monte Carlo outcome variance — i.e. value is set by the multiple the market will pay, a rate/sentiment regime bet as much as an earnings bet.
Earnings-Call Disconfirmation & Sentiment
Derived signals from the MCH market-data store (Alpha Vantage transcripts + news). Quantitative tone only — a disconfirmation flag, not a substitute for reading the call.
Management vs analyst tone (2026Q1): management +0.32 vs analyst floor +0.00 → delta +0.32 (n=24 mgmt / 12 Q&A; 37th pctile across the S&P book, z -0.5).
Flag: TYPICAL — management-vs-analyst tone within the normal cross-sectional range.
| Quarter | Mgmt | Analyst | Delta |
|---|---|---|---|
| 2026Q1 | +0.32 | +0.00 | +0.32 |
| 2025Q4 | +0.50 | +0.01 | +0.49 |
| 2025Q3 | +0.60 | -0.02 | +0.62 |
| 2025Q2 | +0.66 | +0.46 | +0.20 |
News (last 365d, 1000 articles): avg ticker sentiment +0.16 (bullish 16% / bearish 4%)
Scenario Analysis
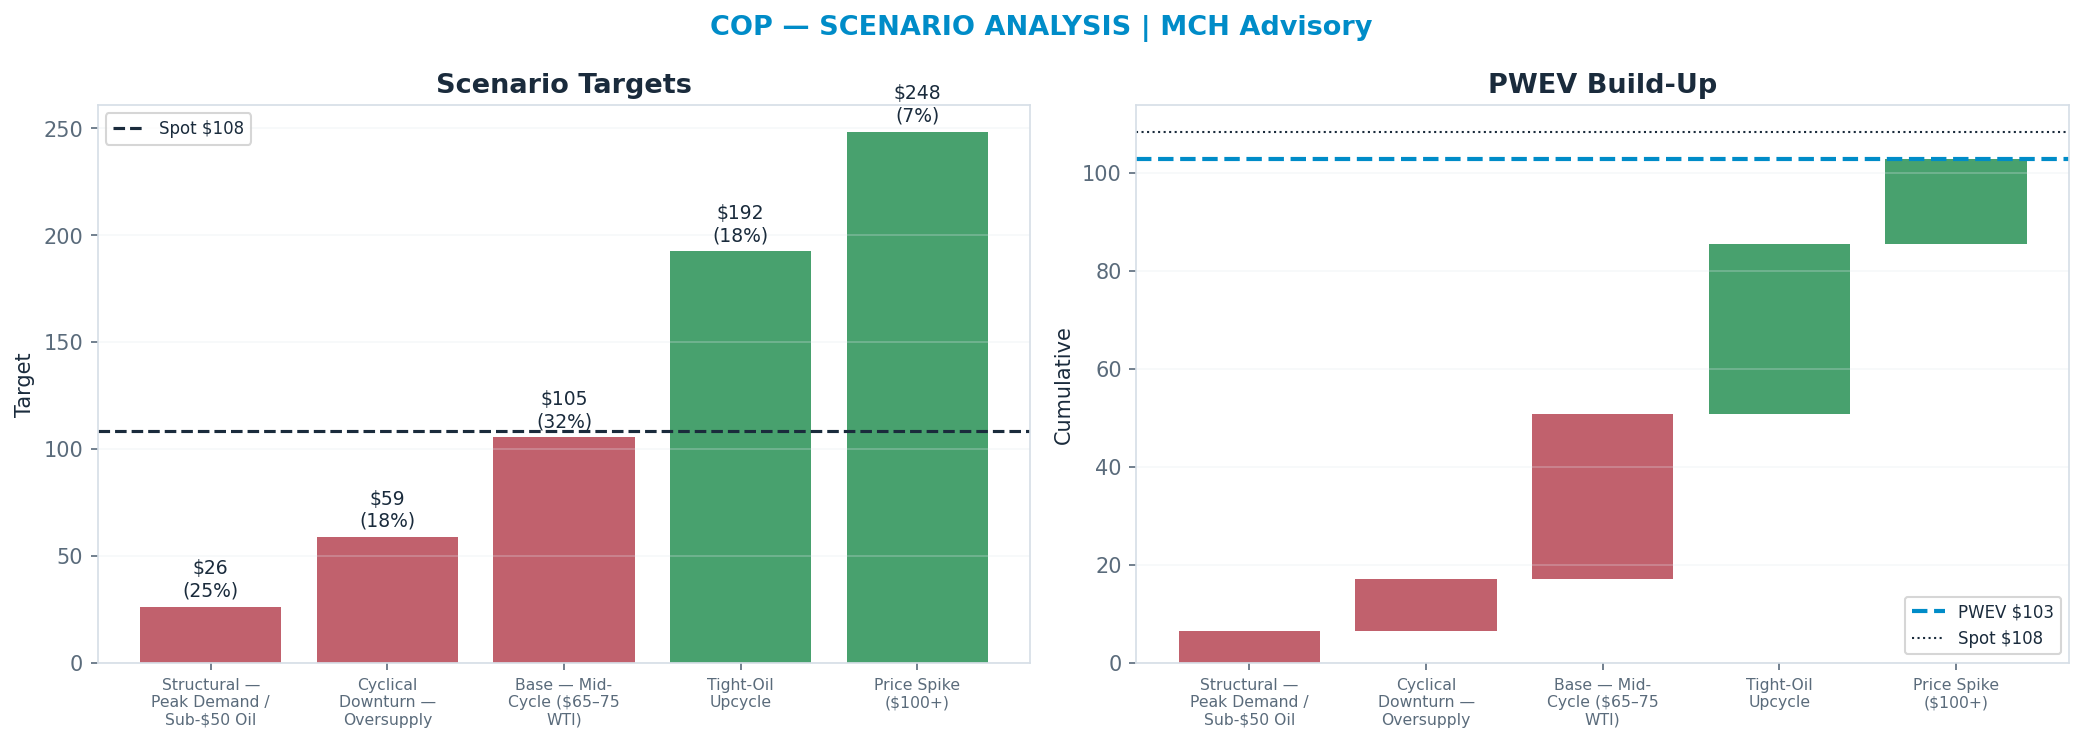
The tree runs from a structural 'Structural — Peak Demand / Sub-$50 Oil' downside ($26) to a 'Price Spike ($100+)' bull case ($248); the probability-weighted blend (PWEV $103) is -5% versus spot.
| Scenario | Probability | Target | Return vs spot |
|---|---|---|---|
| Structural — Peak Demand / Sub-$50 Oil | 25% | $26 | -76% |
| Cyclical Downturn — Oversupply | 18% | $59 | -46% |
| Base — Mid-Cycle ($65–75 WTI) | 32% | $105 | -3% |
| Tight-Oil Upcycle | 18% | $192 | +77% |
| Price Spike ($100+) | 7% | $248 | +129% |
| Probability-Weighted (PWEV) | — | $103 | -5% |
Scenario rationale — what each probability buys (the driver path behind every target):
- Structural — Peak Demand / Sub-$50 Oil (25%, $26). Terminal-demand impairment: peak oil/gas demand pulls forward, sustained low realisations and a transition-driven multiple de-rate compress earnings AND the multiple together. Target sits below the 52-week low by construction. Drivers — implied_target: 25.96; probability: 0.25.
- Cyclical Downturn — Oversupply (18%, $59). Cyclical air-pocket — recession/oversupply (or weak cracks) cuts realisations for 1–2 years before normalising. Drivers — implied_target: 58.92; probability: 0.18.
- Base — Mid-Cycle ($65–75 WTI) (32%, $105). Mid-cycle: normalised commodity prices / fee-based throughput, disciplined capex, steady shareholder returns. Drivers — implied_target: 103.0; probability: 0.32.
- Tight-Oil Upcycle (18%, $192). Tight-market upcycle: under-supply lifts realisations/margins above mid-cycle; multiple expands modestly. Drivers — implied_target: 196.11; probability: 0.18.
- Price Spike ($100+) (7%, $248). Geopolitical supply shock or refining dislocation drives realisations sharply above mid-cycle for a period. Drivers — implied_target: 248.75; probability: 0.07.
Valuation Triangulation
Five anchors — but read them with their basis in mind. The Monte Carlo, the DCF terminal, and the peer re-rate all key off a market multiple, so they are not fully independent; only the discounted cash flows themselves are genuinely multiple-free. The discipline is to read the spread and weight the cash-based view, not to treat five numbers as five independent votes.
| Method | Basis | Fair Value | vs Spot |
|---|---|---|---|
| Monte Carlo median (Student-t + regime) | multiple | $92 | -15% |
| Peer P/E re-rate | multiple | $84 | -23% |
| Peer EV/Revenue re-rate | multiple | $151 | +39% |
| Scenario PWEV | multiple | $103 | -5% |
| DCF (5-year + terminal) | cash flow + terminal × | $80 | -26% |
| Triangulated (weighted) | — | $89 | -18% |
Peer EV/Revenue re-rate — 0% weight: it duplicates the peer-multiple information already carried by the Peer P/E anchor while ignoring margin mix; weighting both would double-count the peer view. Shown as a cross-check.
Rating vs blend — the key debate. The rating tracks the multiple-discipline fair value (Monte Carlo $92 + scenario PWEV $103, ≈ spot); the weighted blend $89 (-18%) sits below it because the cash-flow DCF ($80) is materially more conservative than the market multiple. Whether the current multiple is justified is the central question for this name — and the principal downside risk to the rating.
Monte Carlo — the distribution, not a point
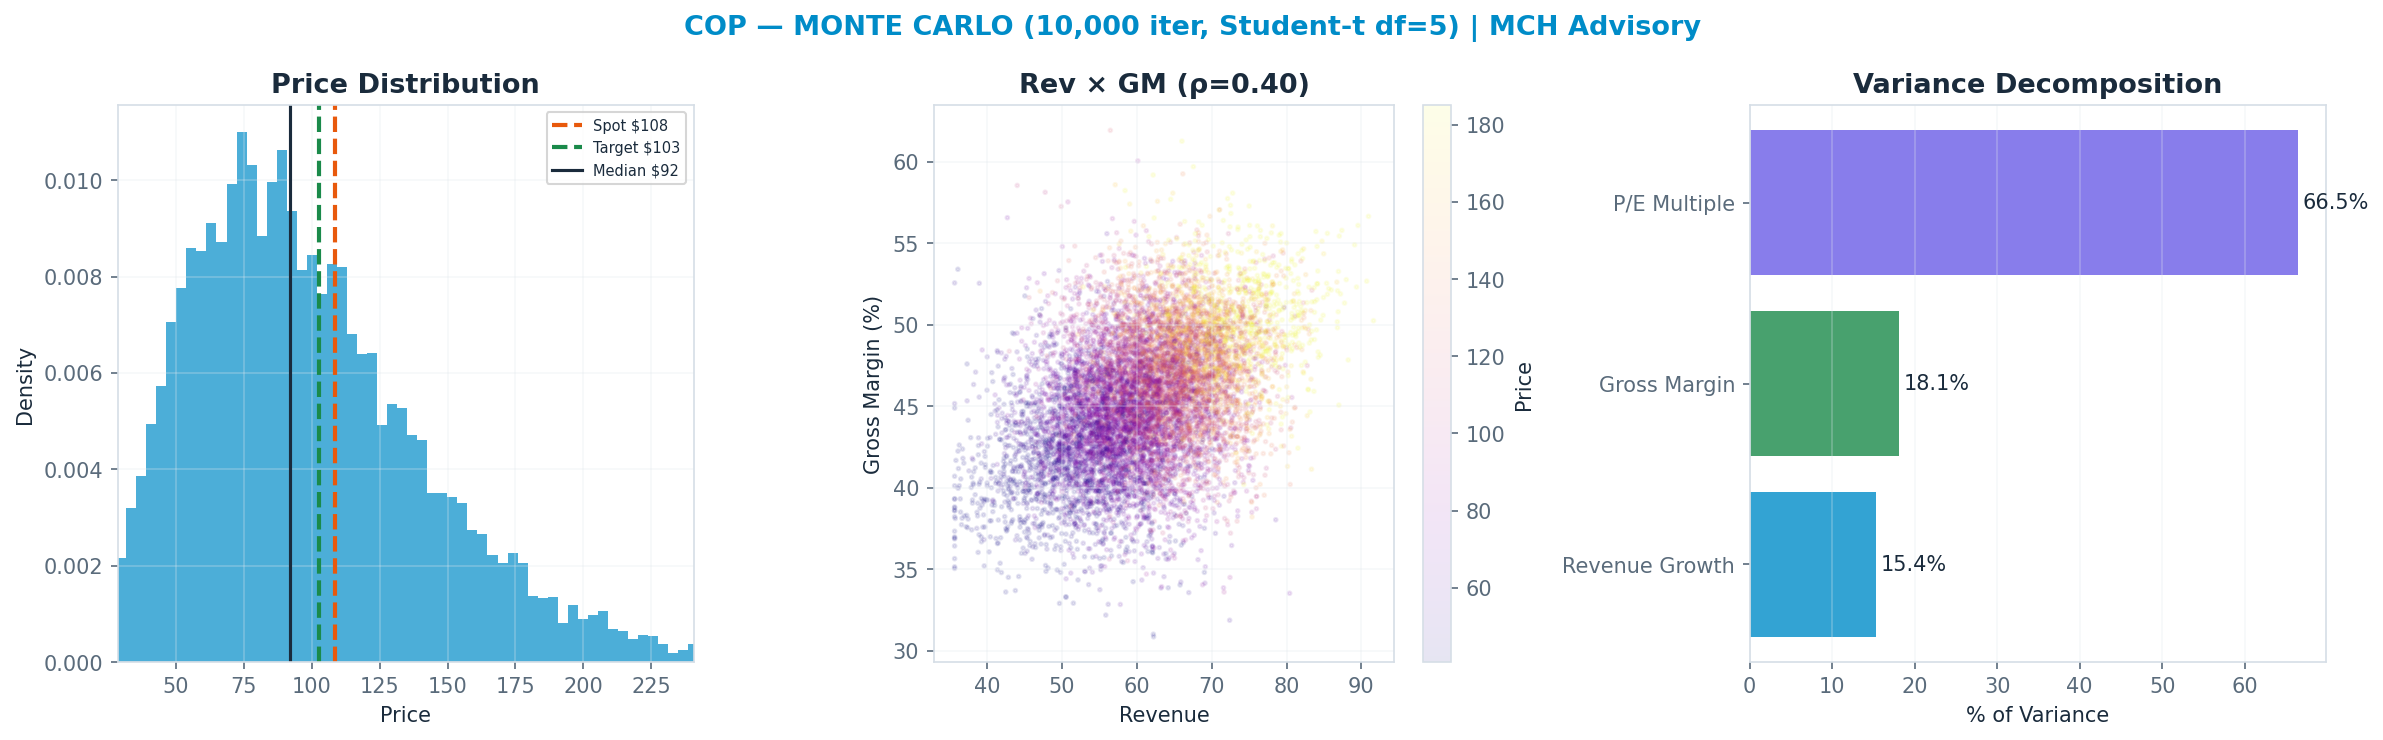
10,000 paths, Student-t shocks (fat tails) with a regime-switching overlay. The median lands at $92 and 36% of paths finish above spot. The variance decomposition shows the p/e multiple is the dominant swing factor (66% of variance). Value is a multiple bet: fundamentals move the answer far less than the rating does.
DCF — the cash-flow anchor
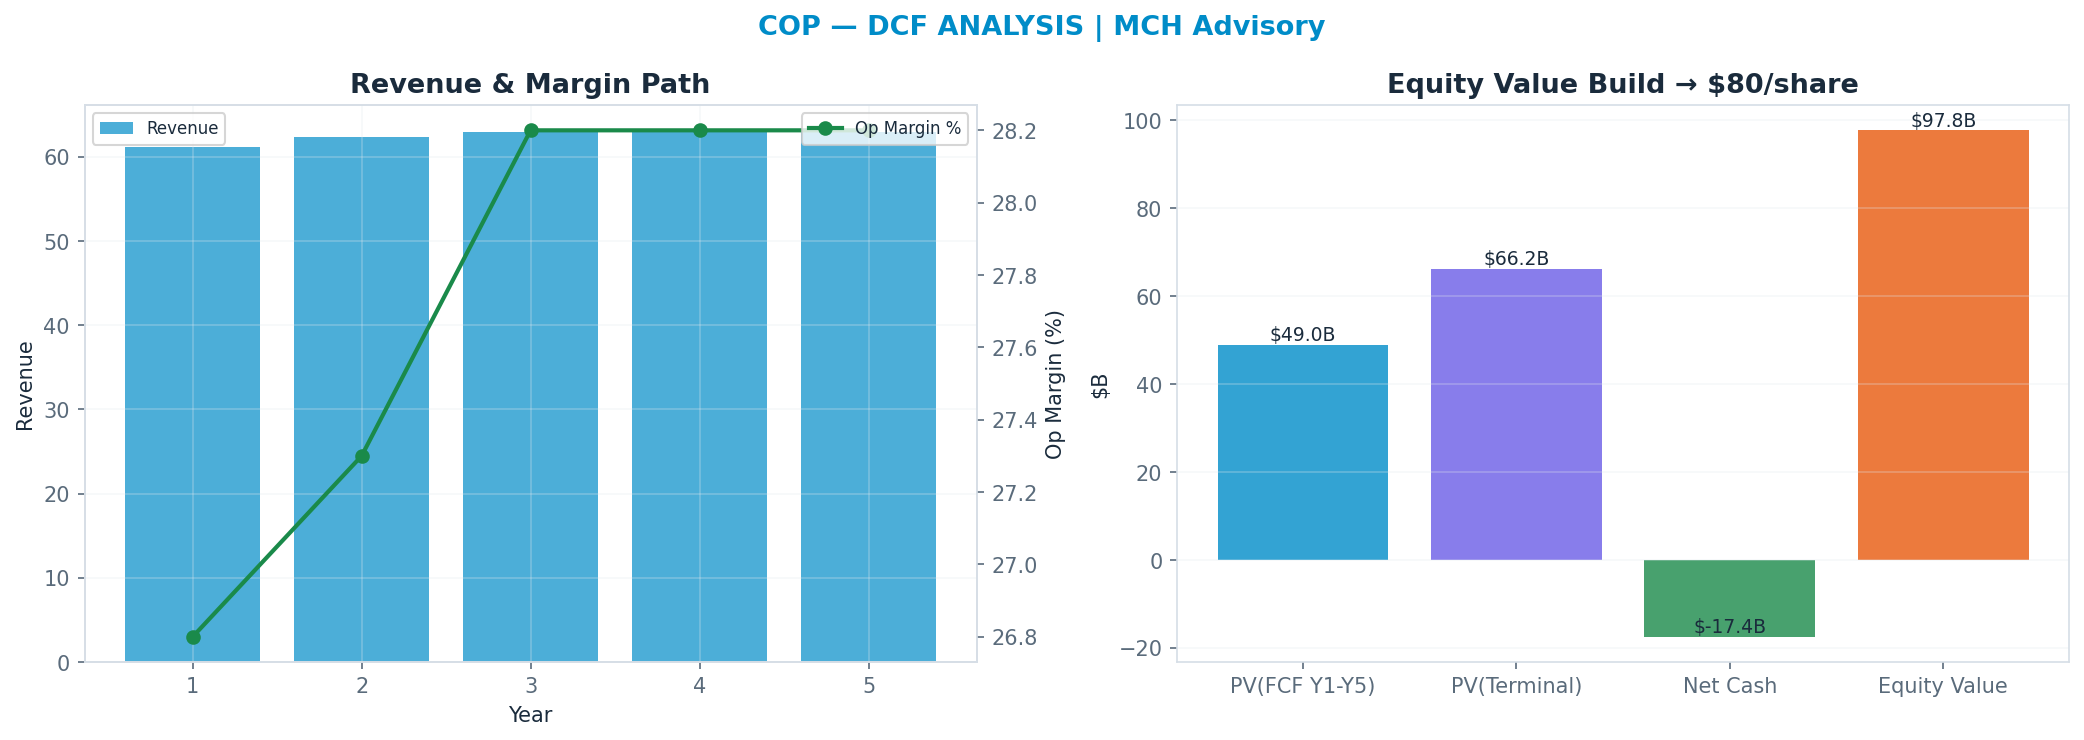
Independent of the market multiple: a 5-year path, WACC 10.0%, 8x terminal FCF multiple → $80. This anchor is deliberately the heaviest (41%): it is the valuation least hostage to the current multiple regime.
Peer benchmarking — relative value
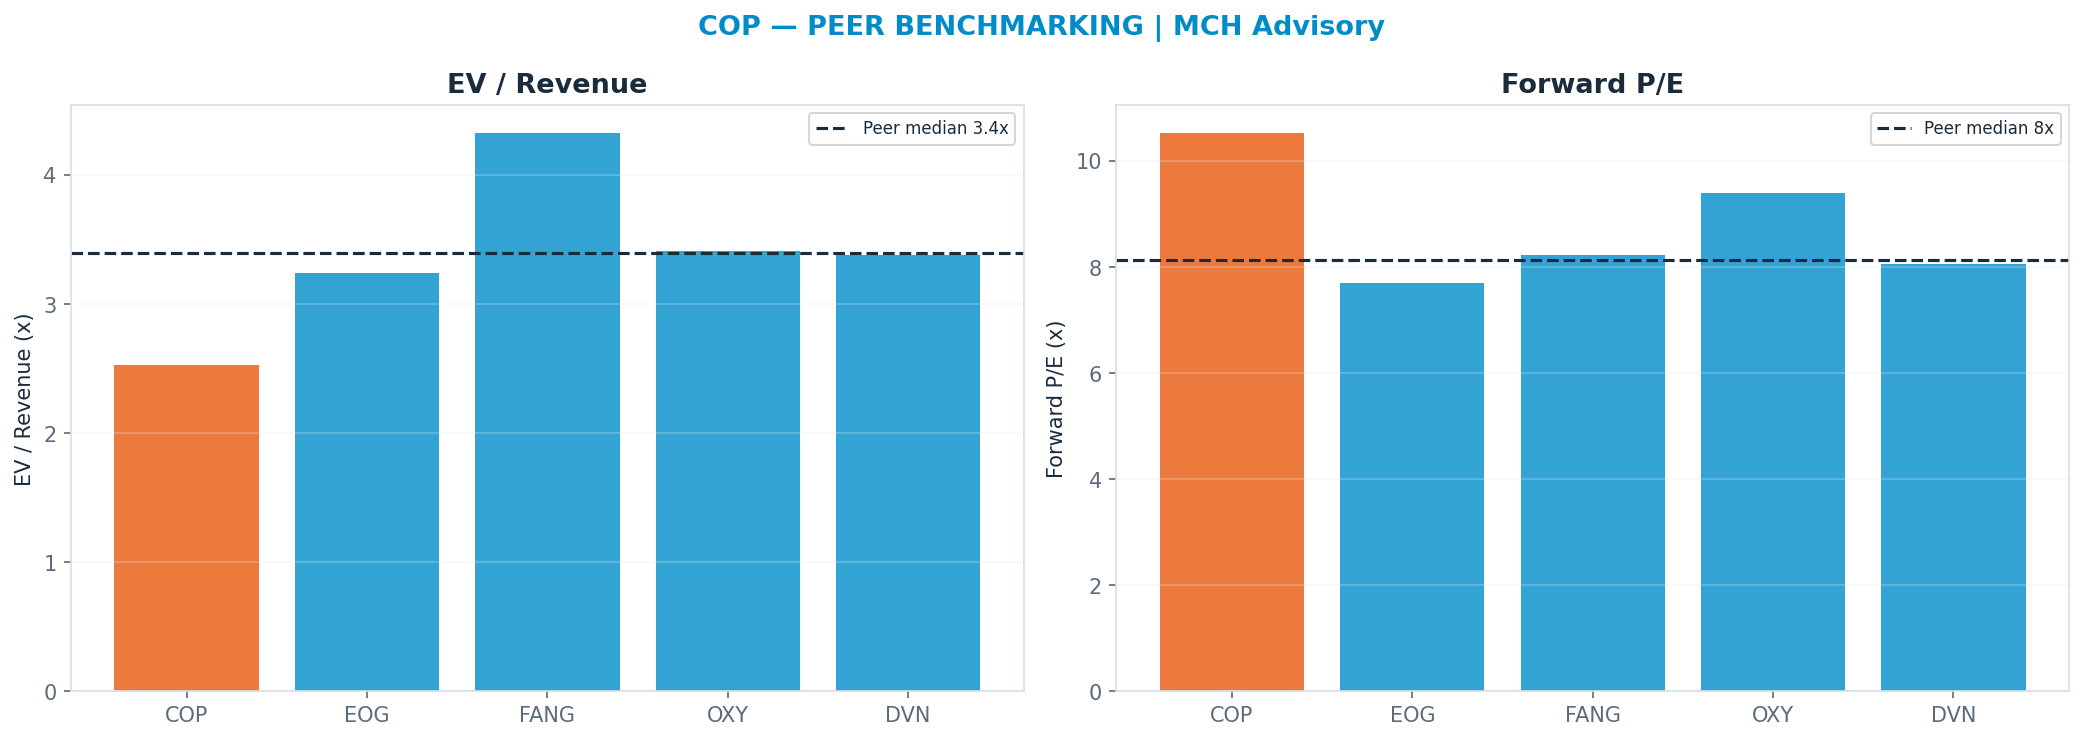
Against the peer cohort, re-rating to the peer-median forward multiple (P/E 8.135000000000002x) implies $84. A premium is only justified by superior growth/margins; otherwise it is multiple risk. Weighted just 12% so the market's mood does not drive the fair value.
Across all anchors the spread is 77% of the median — wide (genuine disagreement — the blend carries low valuation confidence).
Revenue-Segment Breakdown
The company-specific drivers behind the valuation — each segment carries its own growth, margin, multiple and capex intensity. (Tags: FACT reported · ESTIMATE from disclosures · INFERENCE judgment.)
| Segment | Revenue | Mix | Growth | Op margin | EBIT | Multiple | Capex % | Tag |
|---|---|---|---|---|---|---|---|---|
| Upstream (E&P) | $59.4B | 100% | 3% | 27% | $15.9B | 10x | 18% | ESTIMATE |
| EBIT = segment revenue × operating margin (segment EBITDA not shown — per-segment D&A is not separately disclosed). |
Named Exposures
Commodity price cycle (FACT/ESTIMATE)
| Dimension | Assessment |
|---|---|
| driver | Brent/WTI crude + refining cracks |
| operating_leverage | High — earnings swing on price, not volume |
| net_debt_b | -17.45 |
Capital discipline & shareholder returns (ESTIMATE)
| Dimension | Assessment |
|---|---|
| div_yield | 0.0303 |
| fcf_use | Buybacks + dividends; capex restraint vs prior cycles |
Energy transition / terminal demand (INFERENCE)
| Dimension | Assessment |
|---|---|
| risk | Peak oil demand timing; stranded-asset / multiple-compression risk |
| horizon | Structural scenario weight ~20–25% |
Industry Context — Energy — Oil Gas
This name sits in the Energy — Oil Gas as a upstream — pure price beta. ≈ the dependent variable — realisations ARE the P&L; highest beta to the oil/gas state. Its scenarios are not guessed in isolation — they inherit a single, shared view of the cluster's driver cycle, so the names that depend on the same event are mutually consistent.
Value chain: XOM (integrated (up+downstream)) · CVX (integrated (up+downstream)) · COP (upstream — pure price beta) · WMB (midstream — fee-based (low beta)) · KMI (midstream — fee-based (low beta)) · VLO (downstream — crack-spread beta) · MPC (downstream — crack-spread beta) · EOG (upstream — pure price beta) · SLB (services — upstream-capex beta) · PSX (downstream — crack-spread beta) · TRGP (midstream — fee-based (low beta)) · BKR (services — upstream-capex beta) · OKE (midstream — fee-based (low beta)) · FANG (upstream — pure price beta) · OXY (upstream — pure price beta) · DVN (upstream — pure price beta) · EQT (upstream — pure price beta) · HAL (services — upstream-capex beta) · TPL (upstream — pure price beta) · EXE (upstream — pure price beta) · APA (upstream — pure price beta)
| Shared state | Capex path | House view | This name implies |
|---|---|---|---|
| Oil/Gas Bust — Demand Peak / Oversupply | 40% | 43% | |
| Mid-Cycle — Normalised Prices | 34% | 32% | |
| Tight Market — Upcycle / Spike | 26% | 25% |
Mapping note: name-level 'Structural — Peak Demand / Sub-$50 Oil' (25%) + 'Cyclical Downturn — Oversupply' (18%) map to cluster Oil/Gas Bust — Demand Peak / Oversupply (43%); name-level 'Tight-Oil Upcycle' (18%) + 'Price Spike ($100+)' (7%) map to cluster Tight Market — Upcycle / Spike (25%) — the cluster row is the SUM of the mapped scenario probabilities, not a different estimate.
On the cluster's key downside — Oil/Gas Bust — Demand Peak / Oversupply () — this name implies 43% vs the cluster house view of 40% (in line with the house). The cluster's full cross-stock reconciliation governs that the names which ride the same capex cycle assign it comparable odds.
Structure: Shared State — The oil/gas price regime is the single macro driver shared across the cluster. Value Chain — Members differ by position: upstream (price beta) → midstream (fee-based) → downstream (cracks) → services (capex-lagged). Capital Cycle — Post-2020 discipline — FCF routed to buybacks/dividends over volume growth. Transition Tail — Peak-demand timing is the shared structural risk; carries ~20–25% weight book-wide.
Model Appendix
DCF — line items
| Year | Revenue | Op income | − Capex | + D&A | FCF | PV(FCF) |
|---|---|---|---|---|---|---|
| FY+1 | $61B | $16B | $12B | $12B | $12B | $11B |
| FY+2 | $62B | $17B | $13B | $12B | $13B | $11B |
| FY+3 | $63B | $18B | $13B | $12B | $13B | $10B |
| FY+4 | $63B | $18B | $13B | $12B | $13B | $9B |
| FY+5 | $63B | $18B | $13B | $13B | $13B | $8B |
| Terminal | — | — | — | — | $13B × 8x | $66B |
FCF is bridged: NOPAT + D&A − Capex − ΔNWC (capex intensity 18% of revenue, weighted from the segments) — not a single conversion fudge.
WACC 10.0% · Σ PV(FCF) $49B + PV(terminal) $66B = EV $115B; + net cash → equity $98B ÷ diluted shares 1.22B = $80/share (exit-multiple terminal).
- Gordon (perpetuity-growth) terminal at 2.5% → $118/share — a genuinely non-multiple, cash-based cross-check; the exit-multiple and Gordon values bracket the terminal-value risk.
- Incremental ROIC on the forecast capex ≈ 2% vs WACC 10% → below WACC — the incremental build is value-dilutive.
Peer set
| Peer | EV/Rev | Fwd P/E | Growth | Op margin |
|---|---|---|---|---|
| EOG | 3.237x | 7.7x | 3% | 38% |
| FANG | 4.325x | 8.22x | 3% | 6% |
| OXY | 3.41x | 9.4x | 3% | 18% |
| DVN | 3.38x | 8.05x | 3% | 7% |
| Median | 3.395x | 8.135000000000002x | — | — |
Peer-median fwd P/E → $84; EV/Rev → $151.
Weighted fair-value math
| Anchor | Value | Weight | Contribution |
|---|---|---|---|
| DCF | $80 | 41% | $33 |
| Scenario PWEV | $103 | 29% | $30 |
| Monte Carlo median | $92 | 18% | $16 |
| Peer P/E | $84 | 12% | $10 |
| Triangulated | — | 100% | $89 |
Sensitivity
DCF/share — WACC × terminal multiple
| WACC \ Term× | 5.6x | 6.8x | 8.0x | 9.2x | 10.4x |
|---|---|---|---|---|---|
| 8% | $69 | $78 | $87 | $96 | $105 |
| 9% | $66 | $75 | $83 | $92 | $100 |
| 10% | $64 | $72 | $80 | $88 | $96 |
| 11% | $61 | $69 | $76 | $84 | $92 |
| 12% | $58 | $66 | $73 | $81 | $88 |
DCF/share — revenue CAGR Δ × op-margin Δ
| CAGRΔ \ MgnΔ | -3.0pp | -1.5pp | +0.0pp | +1.5pp | +3.0pp |
|---|---|---|---|---|---|
| -3.0pp | $60 | $64 | $69 | $73 | $78 |
| -1.5pp | $64 | $69 | $74 | $79 | $84 |
| +0.0pp | $69 | $75 | $80 | $85 | $90 |
| +1.5pp | $75 | $80 | $86 | $91 | $97 |
| +3.0pp | $81 | $86 | $92 | $98 | $104 |
Tornado — DCF/share swing by driver (widest first)
| Driver | Low | High | Swing |
|---|---|---|---|
| Capex intensity ±15% | $66 | $94 | $28 |
| Revenue CAGR ±3pp | $69 | $92 | $23 |
| Op margin ±3pp | $69 | $90 | $21 |
| Terminal × ±15% | $72 | $88 | $16 |
| WACC ±1pp | $76 | $83 | $7 |
Company lever — SoP/share vs Upstream (E&P) multiple (AI re-rating) (base 10x)
| Multiple | 7.0x | 8.5x | 10.0x | 11.5x | 13.0x |
|---|---|---|---|---|---|
| SoP/share | $327 | $400 | $473 | $547 | $620 |
Consensus & Market Expectations
| Reference | Value |
|---|---|
| Street target (mean) | $143 (+32% vs spot · street) |
| House target | $103 (-28.2% vs street) |
| Sell-side coverage | 26 analysts (SB 5 / B 14 / H 7 / S 0 / SS 0; net score 0.46) |
| Consensus FY EPS | $9.20; house above (+11.9%) |
| Consensus FY revenue | $66.1B; house below (-7.4%) |
_Consensus figures: Alpha Vantage sell-side aggregates. Where the house view sits materially above or below the street, the divergence is itself a datum — see the thesis.
Balance Sheet & Liquidity
| Metric | Value |
|---|---|
| Net debt | $16.5B — modestly levered |
| Net debt / EBITDA | 0.71x |
| Interest coverage (EBIT / interest) | 11.3x |
| Current ratio | 1.30x |
| Lease obligations | $0.8B |
| Cash & ST investments | $7.0B |
Balance-sheet data as of 2025-12-31 (Alpha Vantage).
Capital Allocation
| Metric | Value |
|---|---|
| Free cash flow | $16.8B |
| Buybacks / dividends | $5.0B / $4.0B |
| Total shareholder yield | 6.8% |
| Payout as % of FCF | 53.7% |
| Reinvestment (capex / OCF) | 15.3% |
| Allocation stance | balanced |
Free-Cash-Flow Quality
| Metric | Value |
|---|---|
| FCF margin | 28.2% |
| FCF conversion (FCF / net income) | 210.0% |
| FCF yield | 12.6% |
| Capex intensity (capex / revenue) | 5.1% |
| FCF − SBC (diagnostic) | $16.8B |
| Capex split (maint / growth) | 55% / 45% — E&P capex is majority sustaining (offsetting decline on producing assets); the growth slice funds Permian/LNG expansion — the bridge flags this build as value-dilutive (~1.9% incremental ROIC) at strip prices. |
Accounting quality: cash conversion (OCF/NI) 248% — cash-backed.
Catalyst Calendar
- 2026-08-06 (~29d) — Quarterly earnings — est. EPS $2.93 (AV EARNINGS_CALENDAR)
- 2026-11-05 (~120d) — Analyst / capital-markets day: 10-year plan, breakeven and returns framework update (authored)
- 2027-01-15 (~191d) — OPEC+ production-policy decision (supply-side swing) (authored)
- 2027-04-01 (~267d) — LNG project / long-cycle sanction or first-cargo milestone (authored)
Forecast Track Record
- EPS surprise: beat 87.5% of the last 8 quarters; average surprise +5.5%.
Competitive Moat
Narrow moat. A commodity E&P has no pricing power — the only 'moat' is a low-cost, long-life resource base and balance-sheet strength, so the DCF terminal multiple is correctly capped near the 8x used; if peak-demand pulls forward, the multiple should de-rate below 8x toward a stranded-asset discount, not expand.
Moat sources:
- FACT: large low-cost-of-supply inventory (Permian/Lower-48, Alaska, global LNG) sets a structural cost advantage vs marginal producers
- FACT: $17.45bn net cash and disciplined capex support returns through the cycle (AV FY2025: $4.0bn dividends, $5.0bn buybacks)
- INFERENCE: no pricing power — realisations are set by Brent/WTI, so earnings swing on price not volume (high operating leverage)
- INFERENCE: moat is cost-curve position plus capital discipline only; it does not defend against a transition-driven demand/multiple de-rate
Regulatory & Legal Risk
| Issue | Probability | Valuation sensitivity | Horizon |
|---|---|---|---|
| Federal drilling-permit / methane and emissions regulation on US onshore and Alaska | medium (~40%) | medium — raises breakevens and constrains inventory; ~8-12% of FV | 12-24m |
| Windfall/carbon taxation or transition-driven cost-of-capital de-rate | low (~25%) | high — a transition de-rate compresses the terminal multiple, the core structural risk; ~15-20% of FV | 12-24m |
Probabilities and sensitivities are analyst estimates, not market-implied.
Scenario Macro & Key Risks
| Scenario | Macro assumption | Key risk |
|---|---|---|
| Structural — Peak Demand / Sub-$50 Oil | Peak oil/gas demand pulls forward; sustained sub-$50 realisations plus a transition-driven multiple de-rate. | Earnings and the multiple compress together; the target sits below the 52-week low by construction. |
| Cyclical Downturn — Oversupply | A recession/oversupply air-pocket (an OPEC+ surge or weak demand) cuts realisations for 1-2 years before normalising. | High operating leverage means earnings fall faster than price, straining the buyback pace. |
| Base — Mid-Cycle ($65–75 WTI) | Normalised $65-75 WTI, disciplined capex and ~$9bn annual cash returns. | The current capex build dilutes value at strip (incremental ROIC ~1.9%), so mid-cycle is already fully paid for. |
| Tight-Oil Upcycle | Tight supply lifts WTI durably above mid-cycle; low-cost inventory captures the margin. | Upcycle windfalls invite windfall taxation and pull forward the demand-peak debate. |
| Price Spike ($100+) | A geopolitical supply shock drives WTI above $100. | The spike is transient and mean-reverts; chasing it risks buying at the cycle top. |
What the Market Is Pricing In
At the current price, the market pays 11.8× forward EPS, vs the house DCF terminal 8.0×, and a peer median 8.135000000000002×. The house DCF sits 26% below spot, so the market is pricing in more than the house case — roughly 2.7pp of revenue CAGR.
Variant perception: the house view is below-consensus, and the thesis is primarily margin-driven.
| Metric | Consensus | House | Importance |
|---|---|---|---|
| Revenue | 66.1 | 61.2 | High |
| EPS | 9.2 | 10.3 | Medium |
| Target price | 143.1 | 102.8 | Medium |
Peer Quality & Weighting
| Peer | Fwd P/E | Growth | Op margin | Quality | Weight cap |
|---|---|---|---|---|---|
| EOG | 7.7× | 3% | 38% | segment | 50% |
| FANG | 8.22× | 3% | 6% | direct | 100% |
| OXY | 9.4× | 3% | 18% | direct | 100% |
| DVN | 8.05× | 3% | 7% | direct | 100% |
Quality-weighted forward P/E: 8.4× (simple median 8.135000000000002×). Direct peers count 100%, segment 50%, broad 25%.
Historical-range cross-check: 52-week range $84–$135, centre $106 (-2% vs spot); spot sits at the 49th percentile of the range. Low-weight mean-reversion cross-check, not a fundamental anchor.
Risk / Reward & Margin of Safety
| Metric | Value |
|---|---|
| Upside to triangulated FV | $89 (-18% vs spot · triangulated FV) |
| Downside to bear case (Structural — Peak Demand / Sub-$50 Oil) | $26 (-76% vs spot · bear scenario) |
| Reward/risk ratio | 0.2× |
| Margin of safety (FV vs spot) | -22% |
| P(price > spot) — Monte Carlo | 36% |
Reward/risk compares triangulated upside against the probability-weighted bear target, not the extreme tail. Bull case (Price Spike ($100+)): $248.
Assumption Register
| Assumption | Value | Used in | Source |
|---|---|---|---|
| WACC | 10.0% | DCF discount rate | estimate (CAPM) |
| Terminal multiple | 8× | DCF exit value | estimate (peer-anchored) |
| Terminal growth | 2.5% | DCF Gordon terminal | estimate |
| SBC dilution | 0.0%/yr | PWEV, MC, DCF (charged once) | estimate (from SBC/rev) |
| EPS basis | consensus forward EPS (broker-adjusted, non-GAAP) | all forward P/E & scenario multiples | definition |
Sensitivity-ranked drivers (widest fair-value swing first): Capex intensity ±15% (28.0); Revenue CAGR ±3pp (23.0); Op margin ±3pp (21.0); Terminal × ±15% (16.0); WACC ±1pp (7.0).
Inputs, Sources & Confidence
Every load-bearing input, labelled by type and confidence. (reported fact · company guidance · consensus estimate · market data · house estimate · inference.)
| Input | Value | Type | Source | Confidence | Used in |
|---|---|---|---|---|---|
| Revenue TTM | $59.4B | reported fact | 10-K/10-Q via AV | High | Forecast base, EV/Rev |
| FY+1 guided revenue | $61.2B | company guidance | Company guidance | Medium | Forecast, SoP |
| Consensus FY EPS | $9.2031 | consensus estimate | Sell-side consensus via AV | Medium | Variant perception |
| Diluted shares | 1.224B | reported fact | 10-K via AV | High | Market cap, per-share |
| Net debt / cash | $16.463B | reported fact | Balance sheet via AV | High | EV, DCF equity bridge |
| WACC | 10.0% | house estimate | CAPM (beta/rf) | Medium | DCF discount rate |
| Terminal multiple | 8× | house estimate | Peer/historical range | Medium | DCF exit value |
| Terminal growth | 2.5% | house estimate | Long-run GDP+ | Medium | DCF Gordon terminal |
Source Log
| Source | Type | Date | Used for | Reference |
|---|---|---|---|---|
| Alpha Vantage — GLOBAL_QUOTE / OVERVIEW | market data | 2026-07-08 | Price, market cap, EV, 52-week range, forward P/E | Alpha Vantage 2026-06-26 |
| Company income statement (10-K / 10-Q) via Alpha Vantage | reported fact | 2026-07-08 | Revenue, gross/operating margin, EBIT, interest expense | INCOME_STATEMENT / latest annual |
| Company balance sheet (10-K / 10-Q) via Alpha Vantage | reported fact | 2026-07-08 | Cash, debt, net debt, leases, equity, coverage | BALANCE_SHEET / latest annual |
| Company cash-flow statement (10-K / 10-Q) via Alpha Vantage | reported fact | 2026-07-08 | Operating cash flow, capex, FCF, buybacks, dividends, SBC | CASH_FLOW / latest annual |
| Company earnings releases via Alpha Vantage | reported fact | 2026-07-08 | Reported EPS, surprise history | EARNINGS / quarterly |
| Sell-side consensus via Alpha Vantage | consensus estimate | 2026-07-08 | Forward revenue/EPS consensus, analyst count | EARNINGS_ESTIMATES |
| Earnings calendar via Alpha Vantage | market data | 2026-07-08 | Next earnings date, catalyst timing | EARNINGS_CALENDAR |
| Company guidance | company guidance | 2026-07-08 | FY guided revenue / non-GAAP EPS basis | company guidance / earnings call |
| MCH segment model (from filings & disclosures) | house estimate | 2026-07-08 | Segment revenue, margins, multiples, AI decomposition | company_context (authored, tagged) |
| MCH qualitative analysis | inference | 2026-07-08 | Moat, regulatory risk, scenario macro, catalysts | company_context enrichment (authored) |
| MCH investment thesis & falsification triggers | house estimate | 2026-07-08 | Thesis, anti-thesis, thesis-break signals | authored §5.3 |
Citation coverage: 13/14 mandated claims sourced. Filing URLs are not available via the market-data provider; company statements are cited as 10-K/10-Q via Alpha Vantage.
Load-Bearing Assumptions
DCF: WACC 10%, terminal multiple 8×, FY+5 revenue $63B. Triangulation leans 41% on DCF, 29% on PWEV.
Reasons the Thesis Could Fail (Falsifiable)
Pre-registered signals that would break the thesis — each polices a specific scenario boundary and is checked at every earnings update:
- Average quarterly WTI benchmark ($/bbl) < 60 (2 consecutive prints → Oil/Gas Bust — Demand Peak / Oversupply). Midpoint between the $65–75 WTI base band and the sub-$50 structural bear. Two quarters averaging below $60 falsify the mid-cycle price assumption and shift weight towards the bear pair.
- Annualised revenue ($B, quarterly print × 4) < 56 (2 consecutive prints → Oil/Gas Bust — Demand Peak / Oversupply). Midpoint of the $61.2bn FY revenue guide and the ~$50.5bn cyclical-downturn revenue path (−15% growth on the $59.4bn base). Sustained prints below it falsify mid-cycle realisations.
- Operating margin (quarterly) < 0.23 (2 consecutive prints → Oil/Gas Bust — Demand Peak / Oversupply). Midpoint of the 26.7% base operating margin and the 19% cyclical-downturn margin. With pure price beta, margin breaks before volume does — two prints below 23% mean realisations, not costs, have rolled.
- FY capital expenditure guidance ($B) > 14 (single event → capital_cycle — post-2020 discipline). A guide above $14bn — roughly 10% over the top of the authored $12–13bn schedule — breaks the capital-discipline pillar that funds the shareholder-return case and would push incremental ROIC (already ~1.9% on the engine's bridge) further below the cost of capital.
- Annualised dividends plus buybacks ($B, cash-flow statement) < 6 (2 consecutive prints → capital_cycle — post-2020 discipline). FY2025 cash returns ran near $9.0bn (AV: $4.0bn dividends plus $5.0bn repurchases). A fall below $6bn annualised signals FCF stress consistent with the bear pair, not a mid-cycle wobble — buybacks are the first casualty of sub-$60 oil against $17.45bn of net debt.
Fact / Inference / Speculation
- FACT: Spot $108; 52-week range $84–$135; engine rating HOLD; base-case target $103 (-5%). (source: Alpha Vantage 2026-06-26, 8 July 2026)
- INFERENCE: Triangulated FV $89 (-18% vs spot · triangulated FV); the rating tracks the Monte-Carlo + scenario-PWEV core; the cash-flow anchor sits below the multiple-discipline core.
- SPECULATION: At current prices the embedded bet is that the market keeps paying the current multiple through the capex cycle — a regime call the engine cannot verify from fundamentals alone.
Recommendation: HOLD
Balanced: triangulated fair value $89 (-18% vs spot); the outcome hinges on P/E Multiple. The debate is P/E Multiple — fundamentally a multiple/regime call.
Disclosures & Limitations
This report is for informational and research purposes only. It is not personalised investment advice and does not consider any investor's objectives, financial situation, risk tolerance, tax position, or liquidity needs.
- No suitability assessment has been performed for any individual.
- Market data may be delayed or inaccurate; figures are as of the analysis date.
- Model outputs (fair values, targets, scenario probabilities) are estimates and may be wrong.
- Forecasts are uncertain; past performance is not indicative of future returns.
- The author or publisher may hold positions in securities mentioned.
- Users should verify information against primary sources (company filings) before acting.
- Investing involves risk of loss; there is no guarantee any target price is achieved.
- Ratings follow a defined research methodology (12-month expected-return thresholds), not individual circumstances.