Rating: HOLD
HOLD (5-tier) · quality defensive · conviction: low
| Metric | Value |
|---|---|
| Current Price | $504 |
| Triangulated Fair Value | $550 (+9% vs spot · triangulated FV) |
| 12-mo Scenario PWEV | $513 (+2% vs spot · 12m PWEV) |
| Market Cap | $712B |
| 52-Week Range | $455–$517 |
EPS basis for the forward P/E and all scenario multiples: consensus forward EPS (broker-adjusted, non-GAAP).
Methodology: Valuation triangulated across five independent anchors — Monte Carlo (Student-t + regime switching), an independent DCF, peer re-rating, a sum-of-parts, and a scenario-weighted PWEV. Figures reconciled to mch_weekly_run live prices. Each chart below sits with the part of the thesis it evidences.
General research for a skeptical institutional reader. Not personalised investment advice; no position sizing or trade instructions. Figures as of the analysis date; verify before acting.
Investment Committee Summary
| Rating | HOLD · HOLD (5-tier) |
| Classification · conviction | quality defensive · low |
| Triangulated fair value | $550 (+9% vs spot · triangulated FV) |
| 12-mo scenario PWEV | $513 (+2% vs spot · 12m PWEV) |
| Next catalyst | 2026-08-07 — Quarterly earnings |
| Primary thesis-break | Combined insurance underwriting pre-tax result (GEICO, Primary and Reinsurance), quarterly < US$1.0B pre-tax profit per quarter (2 consecutive prints) |
📎 Download the full model (Excel) — DCF line items, scenarios, sensitivity, assumptions, and extended fundamentals.
Rating Bridge
Rating = HOLD because:
- Probability-weighted scenario value implies +2% vs spot
- Monte Carlo median implies -20% vs spot
- Bear case (Recession + Mark-to-Market) downside is -29% vs spot
- Net: reward/risk of 0.3× is not asymmetric enough for a Buy and not impaired enough for a Sell — hence Hold.
Investment Thesis
At $500.39 (1 July 2026) the shares sit mid-range between the 52-week extremes of $455.19 and $516.85, and the market is paying roughly 1.5x book — pricing Berkshire as a mature compounder with little credit for the $325B cash pile beyond bill yield. The engine's sum-of-parts anchor is $678 per share, well above spot, but that gap is mostly locked capital: the cash block is deliberately haircut for reinvestment drag, and the scenario set converts the SoP into a probability-weighted target of $513 — a 35% Base case at $540 against bear paths at $360 and $445 carrying a combined 35% weight. That target is 2.6% above spot, hence HOLD. Monte Carlo puts the probability of finishing above the current price at 34.5%, because reported outcomes are dominated by marks on the roughly $310B equity book rather than by the operating engines. The single most damaging risk is a broad equity drawdown, amplified by Apple concentration, arriving alongside a cyclical contraction in BNSF and the manufacturing businesses.
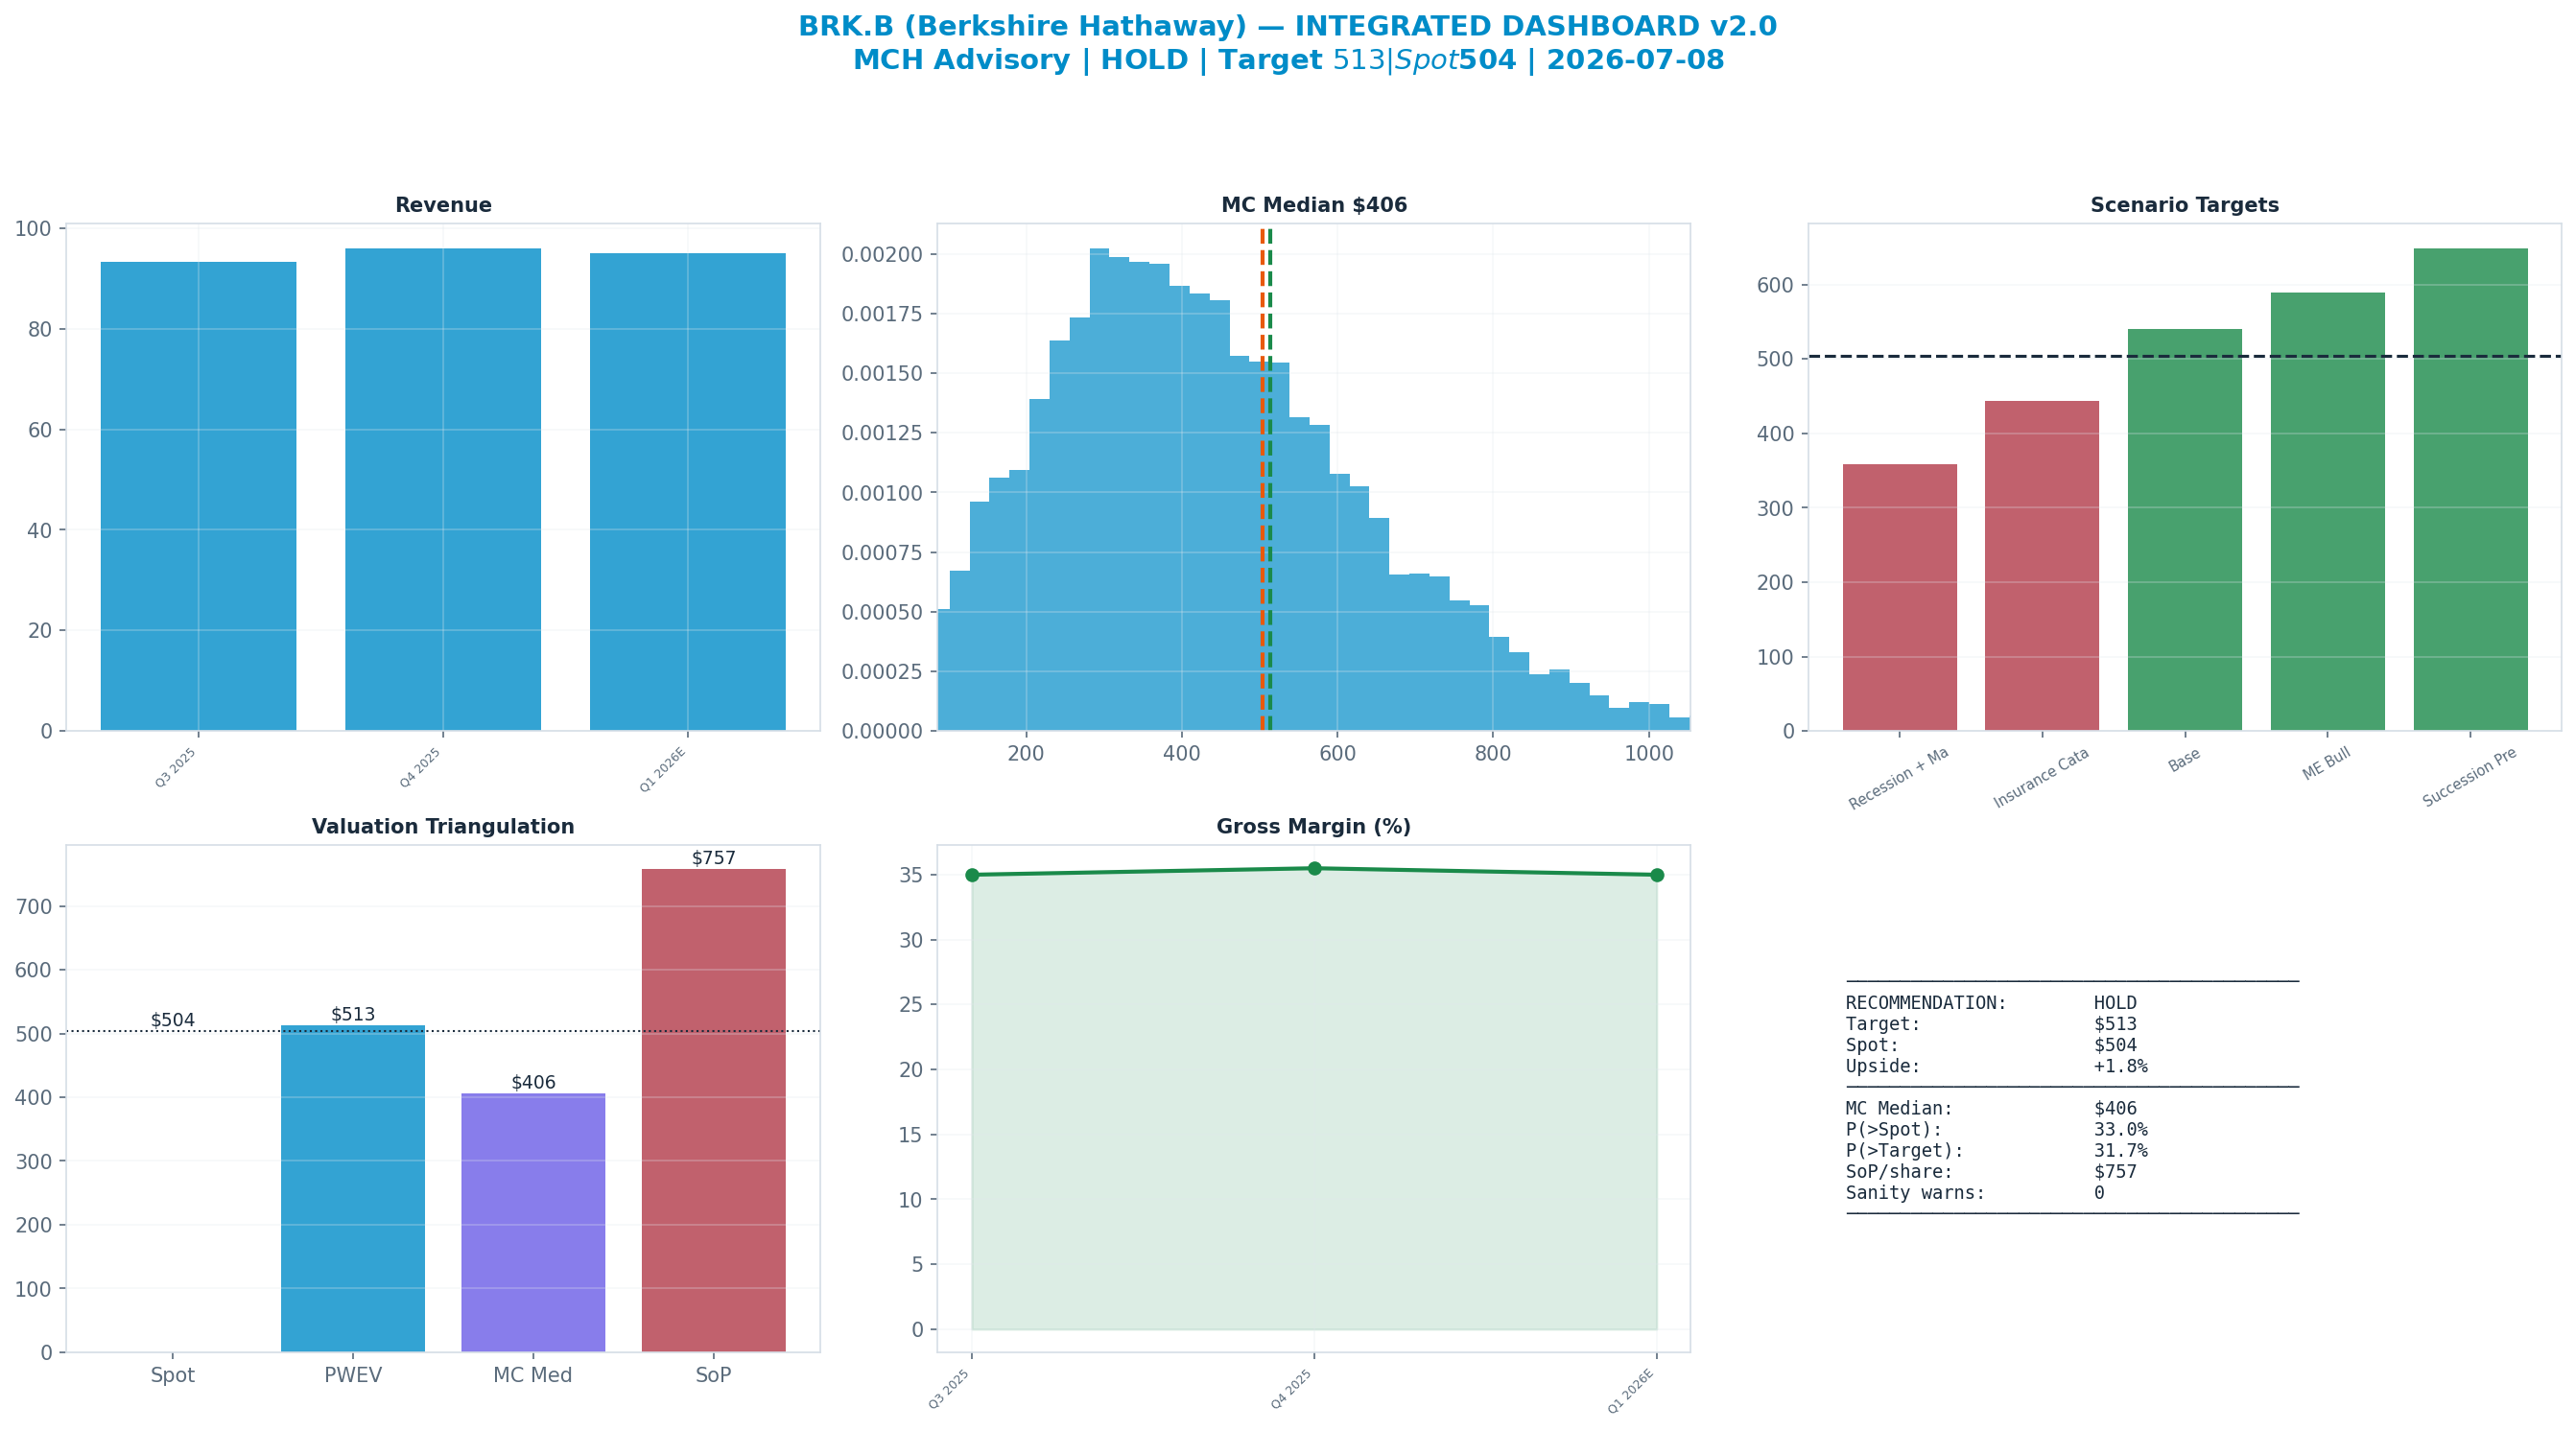
The dashboard below is the whole argument on one page: spot ($504) against each valuation anchor, the scenario tree, technicals and the options-implied move.
Anti-Thesis (The Real Bear Case)
The bear case needs no exotic trigger — only an ordinary equity bear market. Roughly two-thirds of the engine's sum-of-parts sits in marketable securities and cash; a 25-35% market drawdown, amplified by Apple concentration, marks the roughly $310B equity book down by $80-110B, swings GAAP earnings deeply negative and drags book value with it, while BNSF carloads and the housing- and PMI-linked manufacturers contract simultaneously. The celebrated offset — deploying the cash pile into the dislocation — has been scarce for a decade, and the buyer would now be a successor without Buffett's deal flow or reputational premium. The market can apply the key-man discount before any capital is deployed, compressing the multiple toward 1.2x book and the $360 scenario target.
Key Debate
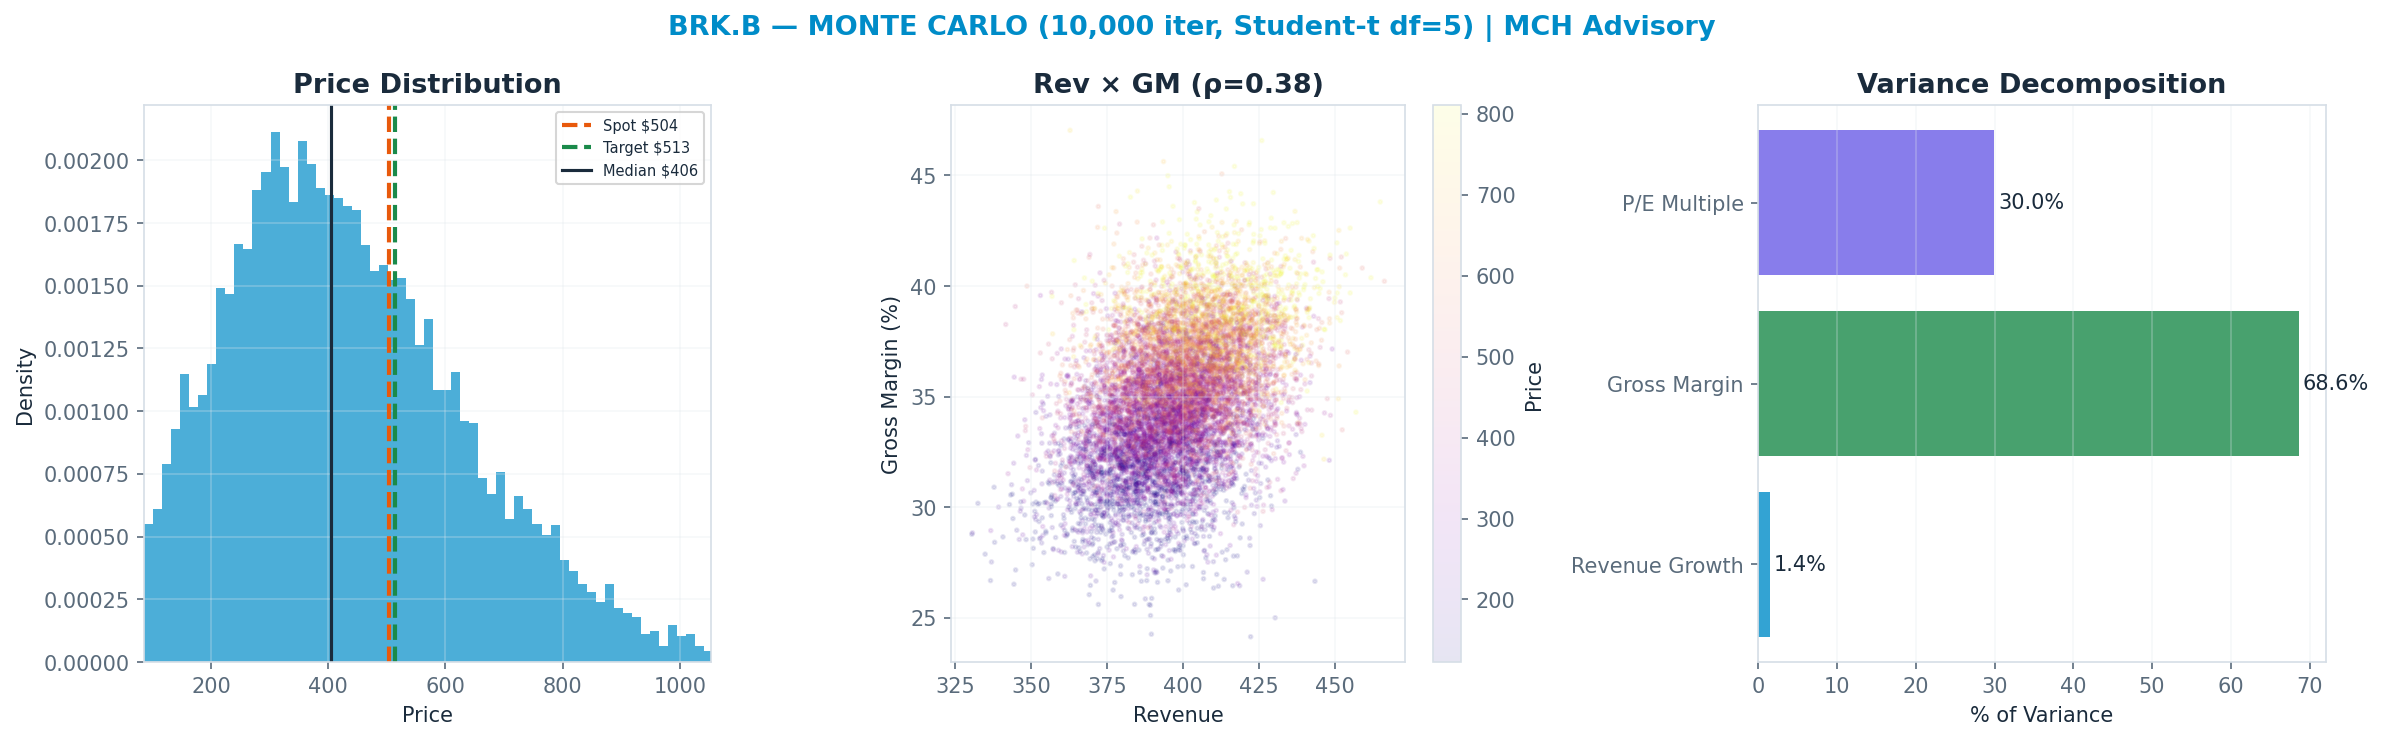
Gross Margin explains 69% of Monte Carlo outcome variance — the single variable that decides which side is right.
Scenario Analysis
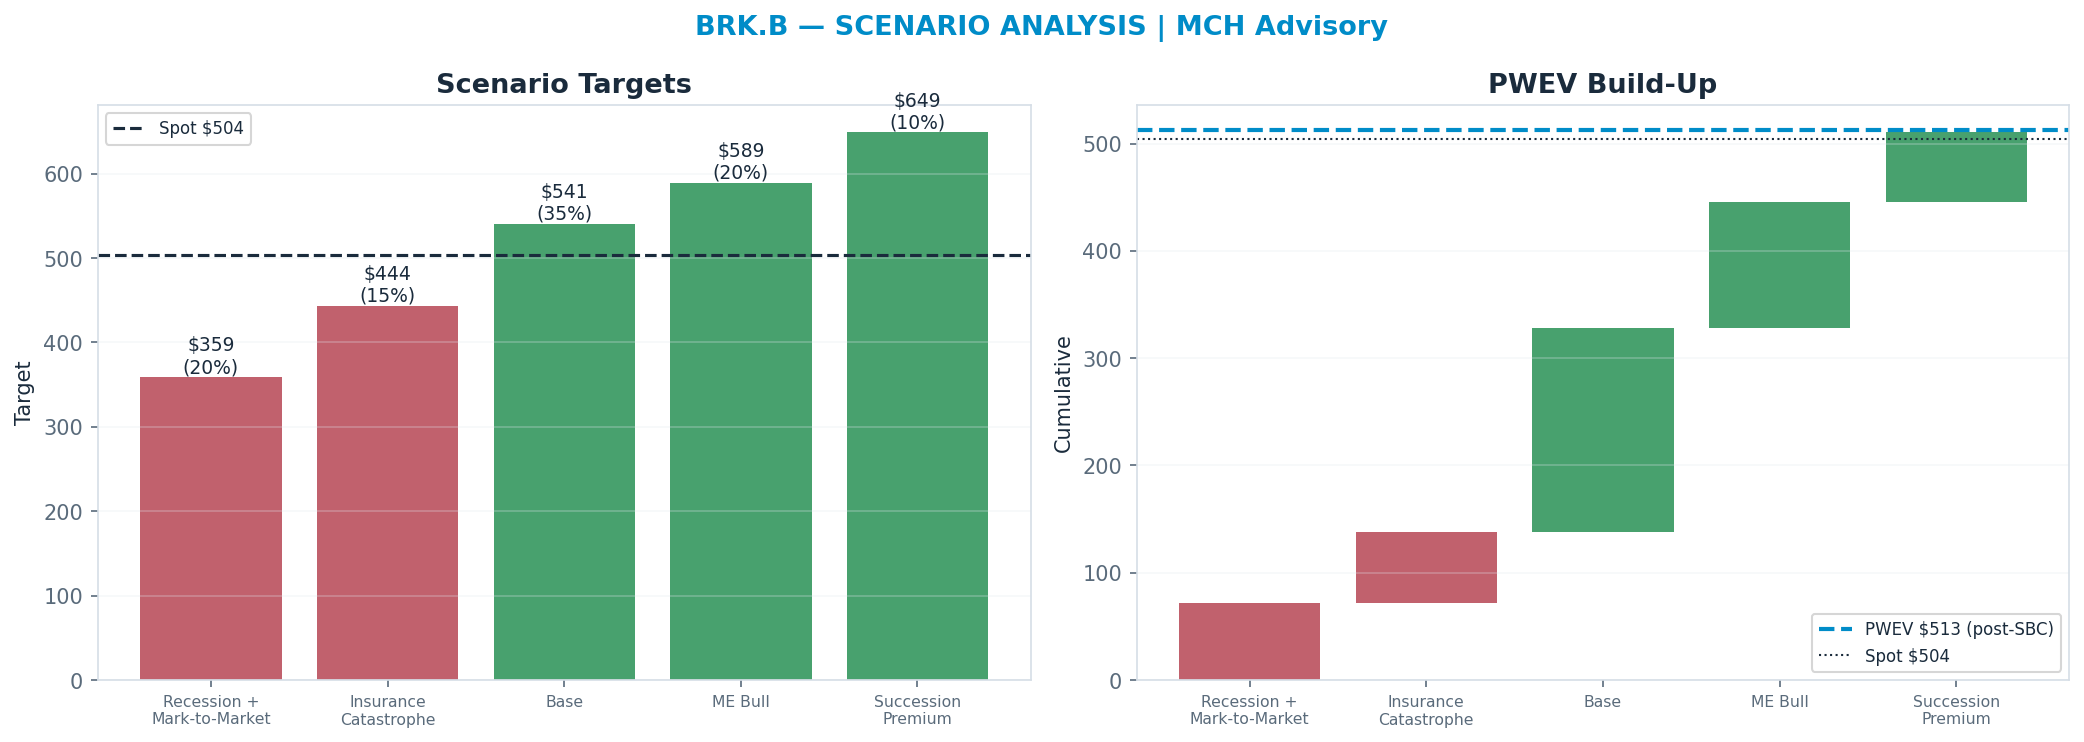
The tree runs from a structural 'Recession + Mark-to-Market' downside ($359) to a 'Succession Premium' bull case ($649); the probability-weighted blend (PWEV $513) is +2% versus spot.
| Scenario | Probability | Target | Return vs spot |
|---|---|---|---|
| Recession + Mark-to-Market | 20% | $359 | -29% |
| Insurance Catastrophe | 15% | $444 | -12% |
| Base | 35% | $541 | +7% |
| ME Bull | 20% | $589 | +17% |
| Succession Premium | 10% | $649 | +29% |
| Probability-Weighted (PWEV, after SBC dilution) | — | $513 | +2% |
SBC charge: scenario targets are gross per-share prices; the PWEV is reduced by one year of stock-based-compensation dilution (-0.5% of shares, on SBC ≈ 0% of revenue), trimming the gross PWEV of $510 to $513 (+0.5%). SBC is charged once, as dilution — never also deducted from FCF.
Scenario rationale — what each probability buys (the driver path behind every target):
- Recession + Mark-to-Market (20%, $359). A broad equity-market drawdown marks the ~$310B portfolio down 25-35% (Apple-led), and cyclical operating earnings (BNSF carloads, MSR industrials) contract simultaneously. GAAP net income turns sharply negative on unrealized losses while book value falls; the P/B multiple compresses toward ~1.2x. The offsetting positive - record cash redeployed into a dislocation - is real but lags the mark, so the trough sits below the 52-week low. Drivers — portfolio_mark: -25% to -35%; operating_earnings: -10% to -15%; book_value_growth: negative; p_b_multiple: ~1.2x.
- Insurance Catastrophe (15%, $444). A major catastrophe year (large hurricane / earthquake / multi-event) drives a sizable underwriting loss across GEICO, Primary and Reinsurance, compounded by a PacifiCorp wildfire-liability escalation at BHE. Underwriting earnings swing negative for the year and float-cost turns positive; book-value growth stalls though the balance sheet absorbs it. The multiple holds near ~1.3x as the loss is judged transient rather than structural. Drivers — underwriting_result: large loss; wildfire_liability: escalates; book_value_growth: ~0%; p_b_multiple: ~1.3x.
- Base (35%, $541). Operating earnings compound at GDP-plus (~5-7%), insurance float grows with near-zero cost and reinvests at attractive Treasury/equity yields, and the portfolio appreciates roughly with the market. Book value compounds high-single-digits and the multiple holds around its recent ~1.5x P/B. Value accrues steadily from retained earnings + buybacks rather than multiple expansion. Drivers — operating_earnings_growth: ~6%; portfolio_return: ~7%; book_value_growth: ~8-10%; p_b_multiple: ~1.5x.
- ME Bull (20%, $589). Berkshire Hathaway Energy's regulated rate base compounds faster than expected on grid/renewables buildout, wildfire-liability overhang resolves favorably, and BHE earnings re-rate toward regulated-utility peers. Combined with steady insurance and rail, book-value growth accelerates and the sum-of-parts gap to intrinsic value narrows; the multiple expands toward ~1.6x. Drivers — bhe_rate_base_growth: >8%; wildfire_overhang: resolves favorably; book_value_growth: ~10-12%; p_b_multiple: ~1.6x.
- Succession Premium (10%, $649). The post-Buffett transition executes cleanly under Abel, the record cash pile is deployed into one or more needle-moving acquisitions at attractive returns, and buybacks continue below intrinsic value. The market re-rates for proven capital-allocation continuity and reduced key-man discount; book-value growth steps up and the multiple expands toward ~1.7-1.8x P/B. Drivers — cash_deployment: large deal(s) at attractive IRR; key_man_discount: narrows; book_value_growth: ~12%+; p_b_multiple: ~1.7-1.8x.
Valuation Triangulation
Five anchors — but read them with their basis in mind. The Monte Carlo, the DCF terminal, and the peer re-rate all key off a market multiple, so they are not fully independent; only the discounted cash flows themselves are genuinely multiple-free. The discipline is to read the spread and weight the cash-based view, not to treat five numbers as five independent votes.
| Method | Basis | Fair Value | vs Spot |
|---|---|---|---|
| Monte Carlo median (Student-t + regime) | multiple | $406 | -20% |
| Sum-of-Parts | multiple | $757 | +50% |
| Scenario PWEV | multiple | $513 | +2% |
| Triangulated (weighted) | — | $550 | +9% |
Monte Carlo — the distribution, not a point
10,000 paths, Student-t shocks (fat tails) with a regime-switching overlay. The median lands at $406 and 33% of paths finish above spot. The variance decomposition shows the gross margin is the dominant swing factor (69% of variance). The fundamental driver, not the multiple, sets the spread — a cleaner setup.
Sum-of-parts
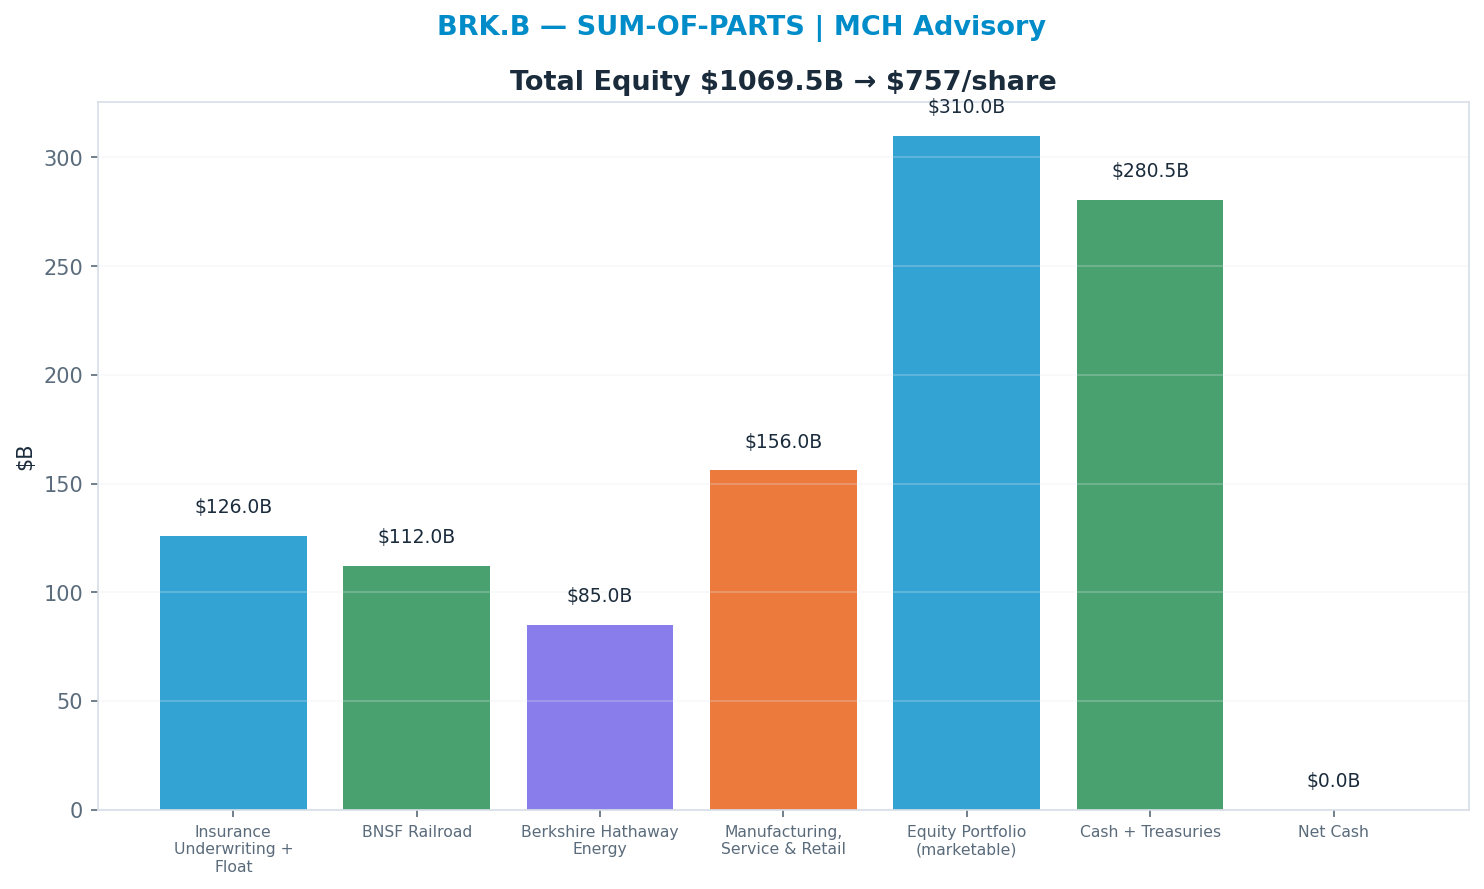
Valuing each piece at the multiple it deserves (Insurance Underwriting + Float 14x, BNSF Railroad 16x, Berkshire Hathaway Energy 17x, Manufacturing, Service & Retail 13x, Equity Portfolio (marketable) 1x, Cash + Treasuries 1x) → $757. 'Equity Portfolio (marketable)' dominates at 1.0× → $310B (29% of EV) — the segment whose multiple matters most.
Across all anchors the spread is 69% of the median — wide (genuine disagreement — the blend carries low valuation confidence).
Revenue-Segment Breakdown
The company-specific drivers behind the valuation — each segment carries its own growth, margin, multiple and capex intensity. (Tags: FACT reported · ESTIMATE from disclosures · INFERENCE judgment.)
| Segment | Revenue | Mix | Growth | Op margin | EBIT | Multiple | Capex % | Tag |
|---|---|---|---|---|---|---|---|---|
| Insurance Underwriting + Float | $9B | 16% | 5% | 10% | $0.9B | 14x | 2% | FACT/ESTIMATE |
| BNSF Railroad | $7B | 10% | 2% | 30% | $2.1B | 16x | 16% | FACT/ESTIMATE |
| Berkshire Hathaway Energy | $5B | 9% | 6% | 18% | $0.9B | 17x | 30% | FACT/ESTIMATE |
| Manufacturing, Service & Retail | $12B | 18% | 3% | 10% | $1.2B | 13x | 4% | FACT/ESTIMATE |
| Equity Portfolio (marketable) | $310B | 30% | 7% | 0% | $0.0B | 1.0x | 0% | FACT/ESTIMATE |
| Cash + Treasuries | $330B | 17% | 0% | 0% | $0.0B | 0.85x | 0% | FACT/ESTIMATE |
| EBIT = segment revenue × operating margin (segment EBITDA not shown — per-segment D&A is not separately disclosed). |
Named Exposures
Equity-portfolio concentration (FACT/ESTIMATE/INFERENCE)
| Dimension | Assessment |
|---|---|
| Largest holding | Apple ~25-30% of the ~$310B marketable equity book (est., post-2024 trimming) - single-name dominance |
| Top-5 concentration | Apple, Bank of America, Coca-Cola, American Express, Chevron together ~65-70% of the equity book (est.) |
| Mark-to-market volatility | Post-ASU 2016-01, unrealized equity gains/losses flow through GAAP net income - quarterly EPS is dominated by portfolio marks, not operating earnings |
| Single-name risk | A drawdown in Apple alone moves reported net income and book value by tens of billions; operating-earnings trend is the cleaner economic signal |
| Energy/financials tilt | OXY (+warrants), Chevron and BofA concentrate exposure to oil price and the rate/credit cycle |
Succession & cash deployment (INFERENCE/ESTIMATE)
| Dimension | Assessment |
|---|---|
| Key-man transition | Post-Buffett leadership (Greg Abel as designated CEO, investment book to Combs/Weschler) - the capital-allocation track record is the moat, and it is personality-dependent |
| Record cash pile | ~$330B+ cash + Treasuries - the largest in company history; signals a lack of large deployable opportunities at acceptable prices |
| Reinvestment drag | Cash earning ~4-5% T-bill yields underperforms the equity compounding investors pay for; a structural drag on intrinsic-value growth until deployed |
| Buyback discipline | Repurchases are price-disciplined (only below intrinsic value) - supportive of per-share value but not a substitute for a large acquisition |
| Deal-scarcity risk | The universe of needle-moving acquisitions for a ~$1T+ enterprise is small; size is now an anchor on the historical compounding rate |
Industry Context — Diversified Holdco
This name sits in the Diversified Holdco as a diversified conglomerate / holdco. Value driven by book-value compounding rather than a single earnings multiple; large listed-equity-portfolio marks (heavy AAPL concentration) flow through book value and reported earnings; insurance underwriting + float supply low-cost investable capital; a record cash pile creates reinvestment drag until deployed; and post-Buffett succession is the key franchise-durability variable. (INFERENCE) Its scenarios are not guessed in isolation — they inherit a single, shared view of the cluster's driver cycle, so the names that depend on the same event are mutually consistent.
Value chain: BRK-B (diversified conglomerate / holdco)
| Shared state | Capex path | House view | This name implies |
|---|---|---|---|
| Recession / Mark-to-Market | broad equity drawdown marks down the listed portfolio; book value contracts, GAAP earnings turn sharply negative on unrealized losses | 20% | 20% |
| Insurance Shock | major catastrophe / reserve event drives an underwriting loss; float economics deteriorate for a period | 15% | 15% |
| Base | operating subsidiaries compound steadily, equity portfolio roughly tracks the market, cash earns front-end yield with no transformational deployment | 40% | 35% |
| Compounding / Re-rate | large-scale capital deployment (acquisition, buybacks at a discount, or portfolio gains) accelerates book-value growth; market re-rates the holdco | 25% | 30% |
Mapping note: name-level 'ME Bull' (20%) + 'Succession Premium' (10%) map to cluster Compounding / Re-rate (30%) — the cluster row is the SUM of the mapped scenario probabilities, not a different estimate.
On the cluster's key downside — Recession / Mark-to-Market (broad equity drawdown marks down the listed portfolio; book value contracts, GAAP earnings turn sharply negative on unrealized losses) — this name implies 20% vs the cluster house view of 20% (in line with the house). The cluster's full cross-stock reconciliation governs that the names which ride the same capex cycle assign it comparable odds.
Structure: Valuation Basis — A holdco is valued on price-to-book and sum-of-parts (operating subsidiaries + listed equity portfolio + cash/fixed income), NOT on a single forward earnings multiple — reported GAAP EPS is distorted by mark-to-market swings on the equity book and is a poor guide to economic earnings. (FACT) Equity Portfolio Marks — A very large listed-equity portfolio with heavy AAPL concentration means book value and headline earnings are highly sensitive to mark-to-market moves in a handful of positions; the portfolio is a leveraged read on broad equity beta plus AAPL idiosyncratically. (FACT) Insurance Float — Insurance underwriting (GEICO, reinsurance, primary) supplies low- or negative-cost float that funds the investment book; underwriting profitability is cyclical and tail-exposed to catastrophe losses, but float is the structural engine of the compounding. (INFERENCE) Cash And Reinvestment — A record cash and short-term Treasury pile is both a fortress and a drag — it earns the front-end yield but signals a scarcity of large deployable opportunities at acceptable prices, so the reinvestment-rate constraint caps forward book-value growth until capital is put to work. (INFERENCE) Succession — Post-Buffett succession (Greg Abel as CEO, separate investment leads) is the key franchise question — operating culture and decentralization likely persist, but the capital-allocation edge that drove historical outperformance is the part most at risk of fading. (INFERENCE)
Catalyst Calendar
- 2026-08-07 (~30d) — Quarterly earnings — est. EPS $5.53 (AV EARNINGS_CALENDAR)
- 2026-11-15 (~130d) — 13-F filing showing Q3 equity-portfolio changes (Apple position, new deployment) (authored)
- 2027-02-27 (~234d) — Annual report + Chairman's letter (authored)
- 2027-05-01 (~297d) — Annual meeting - first full meeting under Greg Abel as CEO (authored)
Competitive Moat
Wide moat. Berkshire's moat is portfolio-level, not single-franchise: durable moats inside BNSF (rail duopoly), BHE (regulated utility), GEICO (low-cost insurance) and permanent, negative-cost float compound capital tax-efficiently, justifying a modest premium to book (~1.5x P/B). But the moat does NOT justify a growth multiple on the ~$325bn cash pile, which earns only bill yield until deployed. Falsifiable: if float growth stalls and cash cannot be deployed at >10% incremental returns, price-to-book should compress toward ~1.2-1.3x, not expand.
Moat sources:
- Permanent low/negative-cost insurance float (~$170bn) funding investments - a structural funding-cost moat
- BNSF: freight-rail duopoly with irreplaceable network/right-of-way
- BHE: regulated utility returns with transmission scale
- Capital-allocation reputation + decentralized ownership giving preferential deal access (succession-sensitive)
Regulatory & Legal Risk
| Issue | Probability | Valuation sensitivity | Horizon |
|---|---|---|---|
| BHE utility rate-case / wildfire-liability regulation (PacifiCorp exposure) | medium (~40%) | medium - utility earnings and liability tail; ~4-6% of FV | 12-24m |
| Insurance regulation / catastrophe-reserving and antitrust scrutiny of scale | low (~20%) | low - diversified segment base absorbs it; ~2-3% of FV | 12-24m |
| Corporate minimum-tax (CAMT) on book income / unrealized gains | medium (~35%) | low - cash-tax timing on the equity book; ~3% of FV | 12-24m |
Probabilities and sensitivities are analyst estimates, not market-implied.
Scenario Macro & Key Risks
| Scenario | Macro assumption | Key risk |
|---|---|---|
| Recession + Mark-to-Market | US recession with an equity-market drawdown; GAAP EPS swings on portfolio marks (Apple-heavy), operating segments soften cyclically. | A deep equity drawdown marks down the ~$310bn equity book, dominating headline EPS even as operating earnings hold. |
| Insurance Catastrophe | Major-catastrophe year (hurricane/wildfire cluster) driving large underwriting losses and reserve strengthening. | Float economics turn temporarily cost-positive and PacifiCorp wildfire liabilities escalate. |
| Base | Steady economy, mid-single-digit operating-earnings growth, cash earns bill yield, opportunistic buybacks below intrinsic value. | Cash drag persists - $325bn stays undeployed, structurally lowering the SoP return. |
| ME Bull | Strong tape; equity book appreciates and large-scale cash deployment (acquisition/repurchase) at attractive returns. | Deployment at premium prices erodes the return advantage that justifies the premium to book. |
| Succession Premium | Smooth Abel-led transition preserves the capital-allocation franchise and the market awards a continuity premium. | Key-person discount re-emerges if post-Buffett capital allocation disappoints in its first cycle. |
What the Market Is Pricing In
Variant perception: the house view is in-line with consensus, and the thesis is primarily event-driven.
| Metric | Consensus | House | Importance |
|---|---|---|---|
| Revenue | — | 394.2 | High |
| EPS | — | 21.2 | Medium |
| Target price | — | 513.3 | Medium |
Historical-range cross-check: 52-week range $455–$517, centre $485 (-4% vs spot); spot sits at the 79th percentile of the range. Low-weight mean-reversion cross-check, not a fundamental anchor.
Risk / Reward & Margin of Safety
| Metric | Value |
|---|---|
| Upside to triangulated FV | $550 (+9% vs spot · triangulated FV) |
| Downside to bear case (Recession + Mark-to-Market) | $359 (-29% vs spot · bear scenario) |
| Reward/risk ratio | 0.3× |
| Margin of safety (FV vs spot) | +8% |
| P(price > spot) — Monte Carlo | 33% |
Reward/risk compares triangulated upside against the probability-weighted bear target, not the extreme tail. Bull case (Succession Premium): $649.
Assumption Register
| Assumption | Value | Used in | Source |
|---|---|---|---|
| SBC dilution | -0.5%/yr | PWEV, MC, DCF (charged once) | estimate (from SBC/rev) |
| EPS basis | consensus forward EPS (broker-adjusted, non-GAAP) | all forward P/E & scenario multiples | definition |
Inputs, Sources & Confidence
Every load-bearing input, labelled by type and confidence. (reported fact · company guidance · consensus estimate · market data · house estimate · inference.)
| Input | Value | Type | Source | Confidence | Used in |
|---|---|---|---|---|---|
| Revenue TTM | $375.4B | reported fact | 10-K/10-Q via AV | High | Forecast base, EV/Rev |
| FY+1 guided revenue | $394.2B | company guidance | Company guidance | Medium | Forecast, SoP |
| Diluted shares | 1.412B | reported fact | 10-K via AV | High | Market cap, per-share |
| SBC dilution | -0.5%/yr | house estimate | From SBC/revenue | Medium | PWEV, MC, DCF (charged once) |
Source Log
| Source | Type | Date | Used for | Reference |
|---|---|---|---|---|
| Alpha Vantage — GLOBAL_QUOTE / OVERVIEW | market data | 2026-07-08 | Price, market cap, EV, 52-week range, forward P/E | mch_weekly_run live prices |
| Earnings calendar via Alpha Vantage | market data | 2026-07-08 | Next earnings date, catalyst timing | EARNINGS_CALENDAR |
| Company guidance | company guidance | 2026-07-08 | FY guided revenue / non-GAAP EPS basis | company guidance / earnings call |
| MCH segment model (from filings & disclosures) | house estimate | 2026-07-08 | Segment revenue, margins, multiples, AI decomposition | company_context (authored, tagged) |
| MCH qualitative analysis | inference | 2026-07-08 | Moat, regulatory risk, scenario macro, catalysts | company_context enrichment (authored) |
| MCH investment thesis & falsification triggers | house estimate | 2026-07-08 | Thesis, anti-thesis, thesis-break signals | authored §5.3 |
Citation coverage: 7/14 mandated claims sourced. Filing URLs are not available via the market-data provider; company statements are cited as 10-K/10-Q via Alpha Vantage.
Load-Bearing Assumptions
No DCF anchor is meaningful for this asset; the blend leans 45% on probability-weighted scenarios and 27% on the Monte Carlo median — the scenario probabilities are the load-bearing inputs.
Reasons the Thesis Could Fail (Falsifiable)
Pre-registered signals that would break the thesis — each polices a specific scenario boundary and is checked at every earnings update:
- Combined insurance underwriting pre-tax result (GEICO, Primary and Reinsurance), quarterly < US$1.0B pre-tax profit per quarter (2 consecutive prints → Insurance Shock). The Base path carries roughly $9B of annual pre-tax underwriting profit growing 5%; the Insurance Catastrophe path collapses the block toward a loss. Two consecutive quarters below $1.0B (about $4B annualised) sits at the midpoint of those paths and signals the pricing cycle or loss experience has genuinely turned rather than one noisy print.
- BNSF pre-tax earnings growth, year-on-year < -4% (2 consecutive prints → Recession / Mark-to-Market). The Base path assumes BNSF grows 2%; the recession path assumes a decline of about 10% as carloads roll over. Two consecutive prints below minus 4% land at the midpoint and indicate the cyclical operating contraction of the bear scenario is under way, not freight-mix noise.
- Cash and short-term Treasuries balance, quarter-end > US$380B (2 consecutive prints → Base). The reconciliation records $325B of cash and bills. A pile grinding past $380B for two straight quarters means deployment is not happening at scale; the Succession Premium path, which depends on redeployment lifting the blended yield on the cash block to 5.2%, is falsified and the reinvestment drag extends indefinitely.
- Incremental PacifiCorp wildfire loss accrual in a single quarter > US$2B (single event → Compounding / Re-rate). The ME Bull path requires the wildfire-liability overhang to resolve favourably. A single new accrual above US$2B demonstrates escalation instead, pushes the BHE block toward the catastrophe path, and removes the re-rate mechanism that carries the 15.5x scenario multiple.
- Quarter-on-quarter change in marketable equity portfolio fair value < -15% (single event → Recession / Mark-to-Market). The recession path marks the roughly $310B equity book down 25-35% over the full scenario. A single quarterly mark worse than minus 15% is roughly half that move in one print, confirms the mark-to-market bear is live rather than hypothetical, and — given Apple concentration — is observable in a single 10-Q investments table.
Fact / Inference / Speculation
- FACT: Spot $504; 52-week range $455–$517; engine rating HOLD; base-case target $513 (+2%). (source: mch_weekly_run live prices, 8 July 2026)
- INFERENCE: Triangulated FV $550 (+9% vs spot · triangulated FV); the rating tracks the Monte-Carlo + scenario-PWEV core.
- SPECULATION: At current prices the embedded bet is that Gross Margin keeps surprising favourably — an operating call the next two prints will test.
Recommendation: HOLD
Balanced: triangulated fair value $550 (+9% vs spot); the outcome hinges on Gross Margin. The debate is Gross Margin — a fundamental call.
Disclosures & Limitations
This report is for informational and research purposes only. It is not personalised investment advice and does not consider any investor's objectives, financial situation, risk tolerance, tax position, or liquidity needs.
- No suitability assessment has been performed for any individual.
- Market data may be delayed or inaccurate; figures are as of the analysis date.
- Model outputs (fair values, targets, scenario probabilities) are estimates and may be wrong.
- Forecasts are uncertain; past performance is not indicative of future returns.
- The author or publisher may hold positions in securities mentioned.
- Users should verify information against primary sources (company filings) before acting.
- Investing involves risk of loss; there is no guarantee any target price is achieved.
- Ratings follow a defined research methodology (12-month expected-return thresholds), not individual circumstances.